Main Quotes Calendar Forum
flag

FX.co ★ Technical analysis on BIDU stock price for week starting August 7th, 2023.

parent
Forex Analysis:::2023-08-07T17:38:40

Technical analysis on BIDU stock price for week starting August 7th, 2023.

Technical analysis on BIDU stock price for week starting August 7th, 2023.

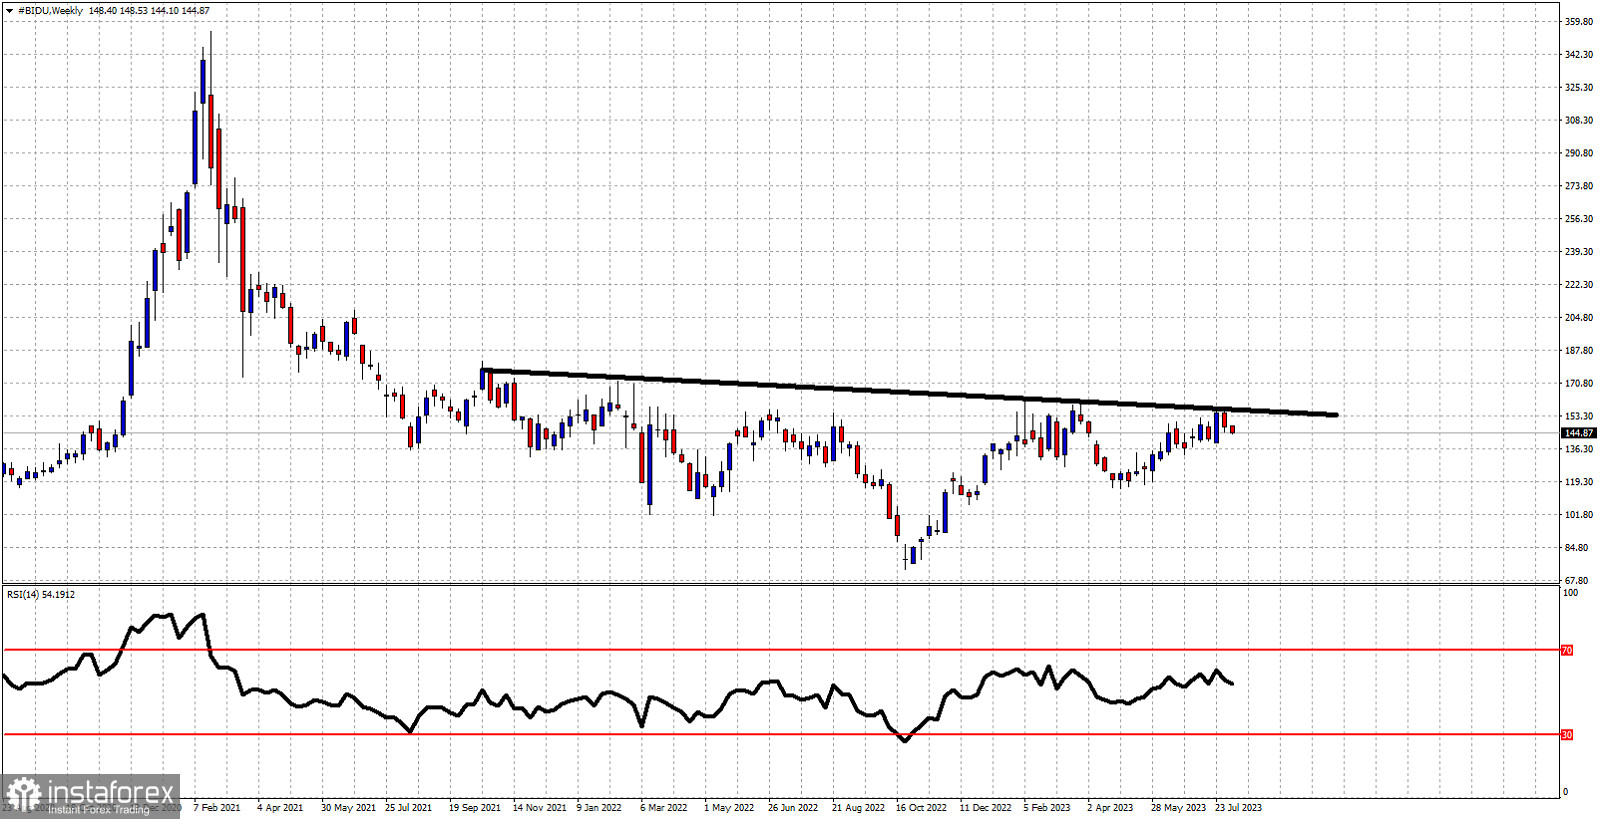
Black line - neckline resistance trend line

BIDU stock price has started trading this week under pressure around $144-$145 after last week's rejection at $156.75. As we mentioned in previous posts, BIDU stock price has formed an inverted head and shoulders pattern with excellent upside potential, IF price breaks above the black resistance trend line. The black neckline resistance has been confirmed several times over the last two years. A weekly close above $157 would provide a bullish signal that will give us $245 as target.

Analyst InstaForex
Share this article:
parent
loader...
all-was_read__icon
You have watched all the best publications
presently.
We are already looking for something interesting for you...
all-was_read__star
Recently published:
loader...
More recent publications...