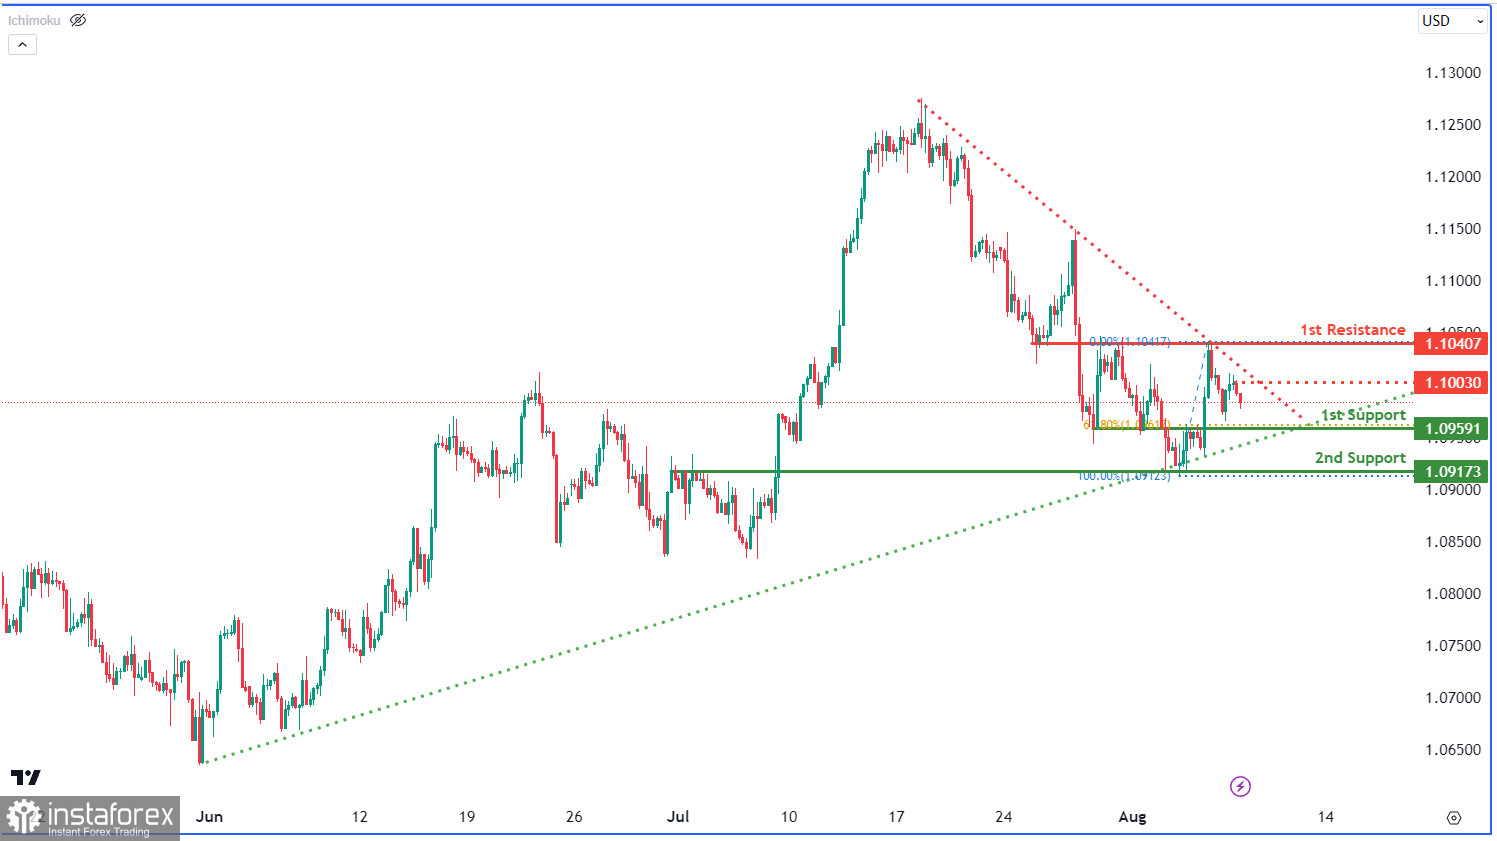
The EUR/USD chart currently shows a neutral overall momentum, lacking a clear directional trend. The price of the currency pair has the potential to fluctuate between the 1st resistance and the 1st support level. The 1st support level at 1.0959 is considered a pullback support, offering a buying opportunity during market retracements, and it gains significance from its alignment with a 61.80% Fibonacci retracement level.
Additionally, the 2nd support level at 1.0917, identified as an overlap support, may also attract buyers' interest and provide further support during price declines. Conversely, the 1st resistance at 1.1040 acts as an overlap resistance, coinciding with a 50% Fibonacci retracement level, potentially limiting upward movement and attracting selling pressure. An intermediate resistance level at 1.1003 adds to the potential resistance points in the price movement. Moreover, the observed chart pattern is a symmetrical triangle, indicating consolidation before a possible breakout or breakdown. A break above the upper trendline suggests a bullish breakout, while a break below the lower trendline indicates a bearish breakdown.


