You require the following to open long positions on the GBP/USD:
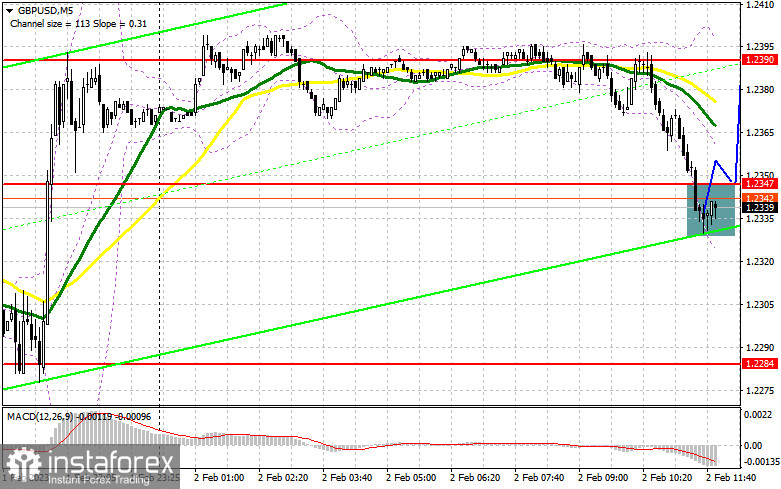
I focused on the level of 1.2347 in my morning forecast and suggested making decisions about joining the market. Let's analyze the 5-minute chart to see what happened. It was impossible to receive a signal to begin long positions because the decrease to 1.2347 took place without the formation of a false breakout. I didn't make many changes to the technical picture, though, because there is still a chance that the bulls will be able to take back 1.2347 following the Bank of England meeting.

Everything will depend on the strategy that the Bank of England will continue to employ, as I said in the forecast for the first half of the day. Given that the regulator doesn't have much of a choice, inflation is still very high, and the working class is demonstrating and striking to demand greater pay, it seems likely that the interest rate will grow quite quickly, which is good news for those who are buying the pound. A good reason to purchase a less expensive pound may be the observed reduction during the morning hours. Naturally, I would like to see buyers present in the market at 1.2347 and a return of the pair. However, if the decline persists, I'll consider making purchases at 1.2284. If that level has a false breakout, it will provide a good entry point for a return to the level of 1.2347, where the primary trade is now being executed. The upward potential is limited by moving averages, therefore purchasers must work really hard. I will speculate on a more pronounced movement of the GBP/USD up to a maximum of 1.2390 in the event of consolidation and a top-down test of this range following the Bank of England's decision. In addition, growth opportunities at 1.2450 and 1.2505, where I fix profits, will become available if one exits above this area. The pressure on GBP/USD will increase if the bulls are unable to complete the tasks assigned to them and miss 1.2284 in response to Governor Andrew Bailey's words, which would cause a significant wave of correction. Because of this, I suggest that you wait before making any purchases and instead begin long positions on a decline and a false breakout close to the minimum price of 1.2237. In order to achieve a correction of 30-35 points within a day, I will buy GBP/USD right away on the rebound only from 1.2172.
You require the following in order to open short trades on the GBP/USD:
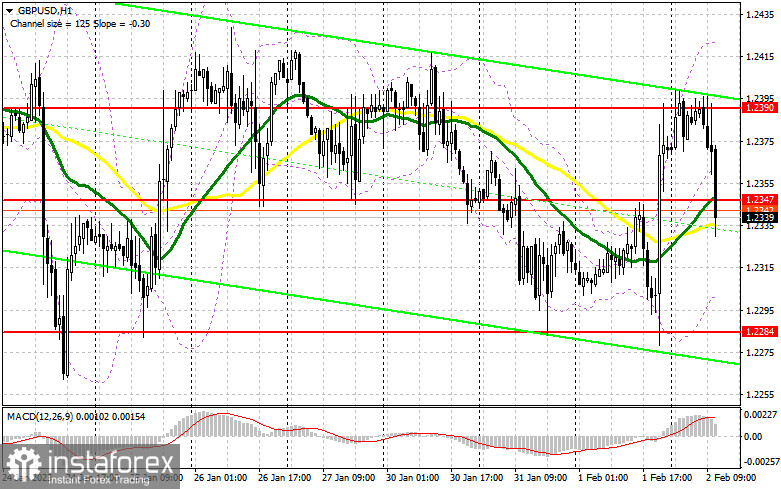
Before the Bank of England meeting, sellers of the pound have already recovered half of yesterday's growth in the pair by probing the market. The fact that the pair is essentially trading in the area of the moving averages suggests that the market is uncertain about the future direction, which gives sellers more hope that they may succeed. Protecting the resistance level of 1.2347, through which the moving averages pass, is the main task right now. In the event of an afternoon upward movement, the development of a false breakout at this level will be enough to generate a sell signal, with the possibility of more active movement back to 1.2284, the side channel's lower boundary. The formation of a sell signal with a move to the level of 1.2337, which is tested to signal an attempt to start a new downward trend, will result from a breakout and reversal test from the bottom up of this range, strengthening the presence of bears in the market. The area of 1.2172 will be the target that is the furthest away, but we won't be able to attain it unless the Bank of England changes its policy to one that is softer, which will be unexpected given the likelihood of high inflation. I'll set the profit there. The possibility of GBP/USD growth and the absence of bearish around 1.2347 will allow the bulls to regain market control. In this instance, the only entry point into short positions with the intention of continuing down is a false breakout in the area of 1.2390. If there isn't any activity, I'll sell GBP/USD right away at the maximum price of 1.2450, but only if I think the pair will fall back by 30-35 points over the day.

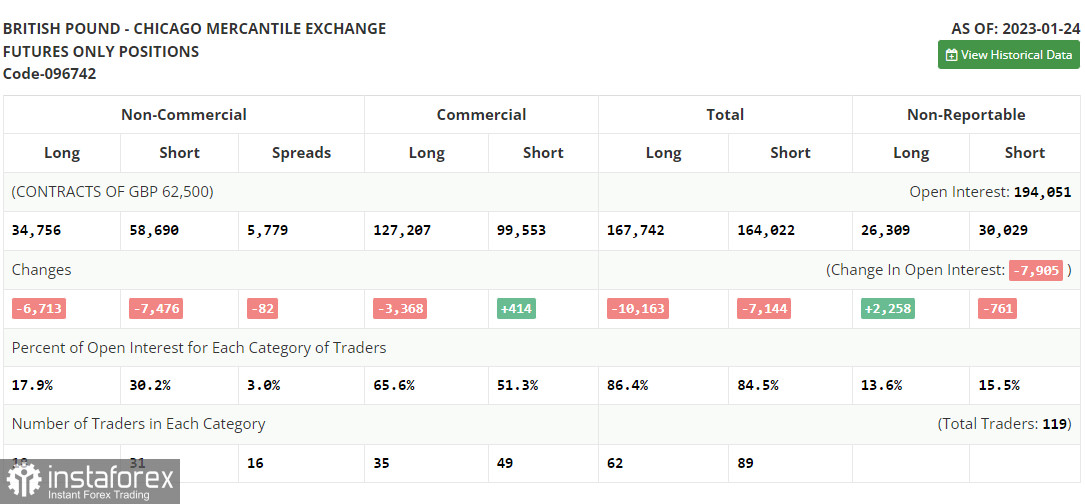
Both long and short positions were dramatically reduced in the COT report (Commitment of Traders) for January 24. However, given the difficulties the UK government is now facing (fighting off strikes and calls for wage increases while also attempting to achieve a sustained fall in inflation) the current reduction was within an acceptable range. However, for the time being, all of this is relegated to the background as we wait for the Federal Reserve System meetings, with its anticipated less aggressive policy, and the Bank of England meetings, with its certainty to maintain an aggressive tone of statements and raise the rate by another 0.5%. All of this will benefit the British pound, therefore I'll wager on it strengthening even more, unless, of course, something extraordinary occurs. According to the most recent COT data, long non-commercial positions declined by 6,713 to 34,756 while short non-commercial positions decreased by 7,476 to 58,690, resulting in a fall in the non-commercial net position's negative value to -23,934 from -24,697 a week earlier. We will continue to keep a close watch on the economic indicators for the UK and the decision made by the Bank of England because such insignificant changes do not dramatically alter the balance of power. In contrast to 1.2290, the weekly ending price increased to 1.2350.

Signals from indicators
Moving Averages
Uncertainty in the market is indicated by trading that is taking place just below the 30 and 50-day moving averages.
Notably, the author considers the time and prices of moving averages on the hourly chart H1 and departs from the standard definition of the traditional daily moving averages on the daily chart D1.
Bands by Bollinger
The indicator's upper limit, which is located at 1.2445, will serve as resistance in the event of growth.
Description of indicators
- Moving average (moving average determines the current trend by smoothing out volatility and noise). Period 50. The graph is marked in yellow.
- Moving average (moving average determines the current trend by smoothing out volatility and noise). Period 30. The graph is marked in green.
- MACD indicator (Moving Average Convergence / Divergence - moving average convergence/divergence) Fast EMA period 12. Slow EMA period 26. SMA period 9
- Bollinger Bands (Bollinger Bands). Period 20
- Non-profit speculative traders, such as individual traders, hedge funds, and large institutions, use the futures market for speculative purposes and to meet certain requirements.
- Long non-commercial positions represent the total long open position of non-commercial traders.
- Short non-commercial positions represent the total short open position of non-commercial traders.
- Total non-commercial net position is the difference between the short and long positions of non-commercial traders.


