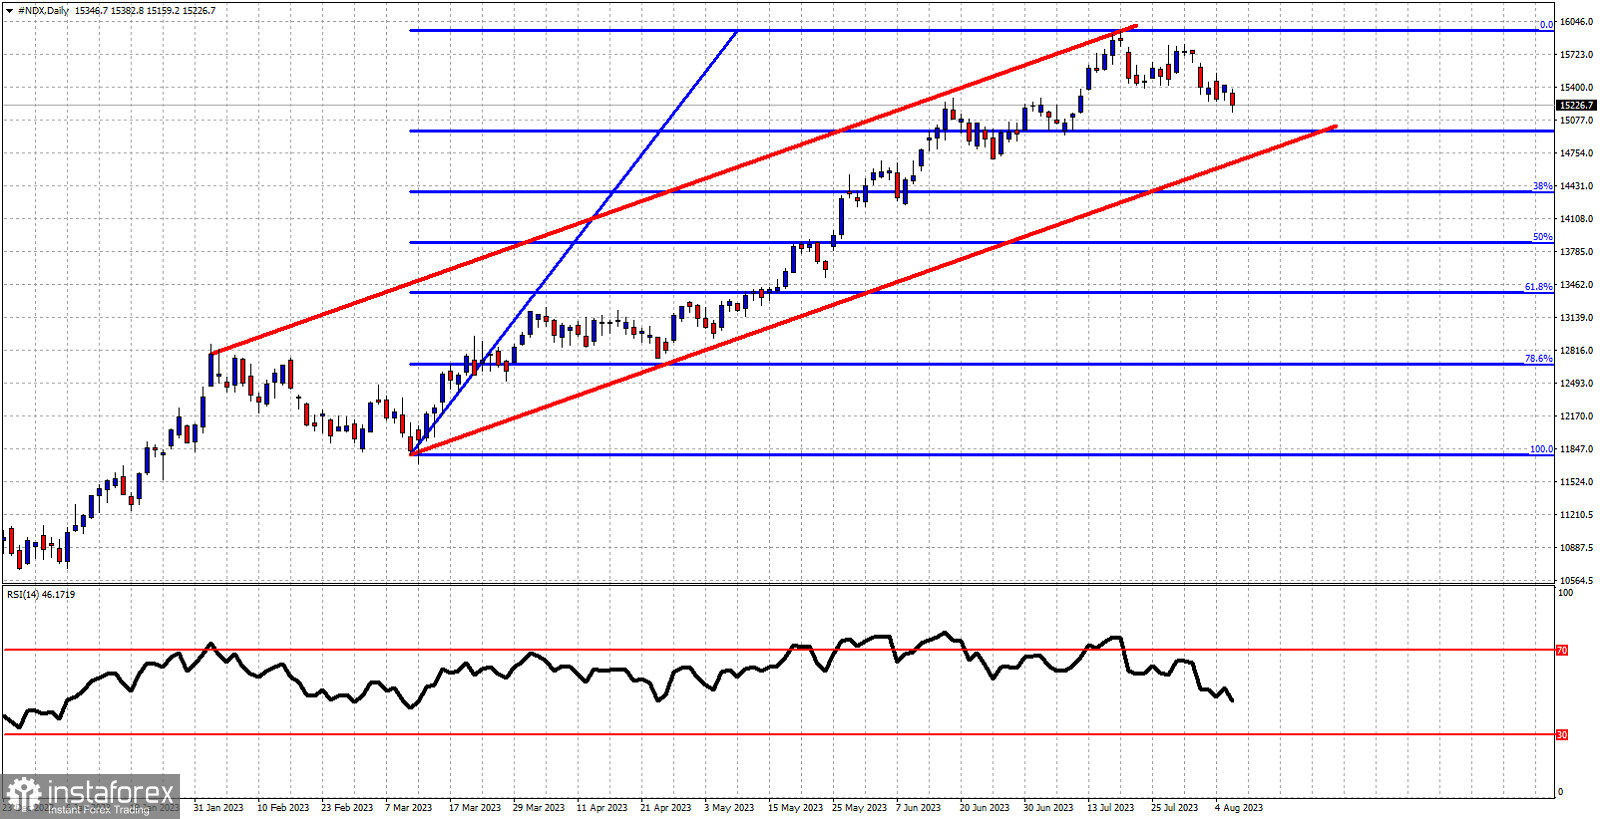
Red lines- bullish channel
Blue lines- Fibonacci retracement levels
Nasdaq is making fresh lower lows on a daily basis as price is now trading around 15,215. Medium-term trend remains bullish as price continues to trade inside the red upward sloping channel. However short-term indicators suggest that we are in a corrective phase with increased chances of a move towards the lower channel boundary. The bearish RSI divergence we noted several days ago justified the pull back we are currently in. The next support by the 23.6% retracement level is found at 14,980. I believe this is the level we are heading towards. A break below this level will open the way for a move towards the lower channel boundary. Short-term resistance is found at 15,520. As long as we trade below this level, I expect price to continue lower.


