


Trend analysis (Fig. 1).
The euro-dollar pair may move downward from the level of 1.0909 (closing of yesterday's daily candle) to 1.0870, the 13-day EMA (thin yellow line). When testing this level, an upward movement is possible with the target at 1.0930, the historical resistance level (blue dotted line).
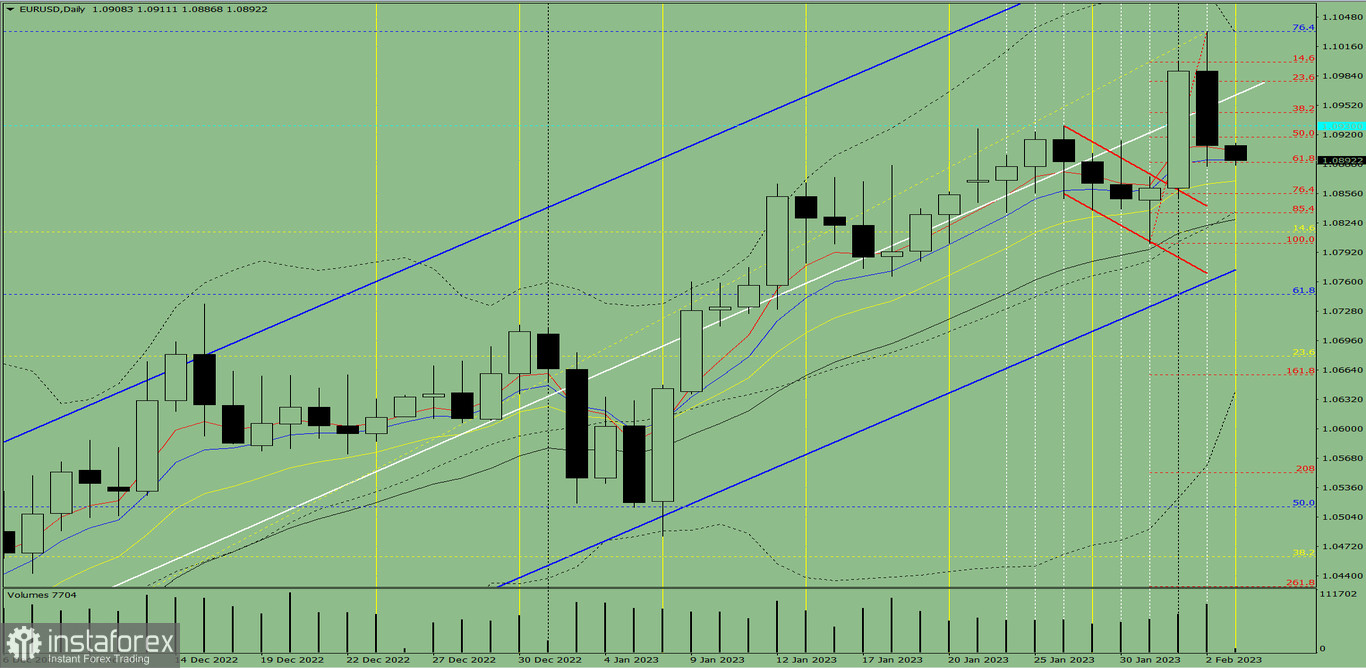
Fig. 1 (daily chart).
Comprehensive analysis:
- Indicator analysis - down;
- Fibonacci levels - down;
- Volumes - up;
- Candlestick analysis - down;
- Trend analysis - down;
- Bollinger bands - up;
- Weekly chart - down.
General conclusion:
Today, the price may move downward from the level of 1.0909 (closing of yesterday's daily candle) to 1.0870, the 13-day EMA (thin yellow line). When testing this level, an upward movement is possible with the target at 1.0930, the historical resistance level (blue dotted line).
Alternatively, the price may move downward from the level of 1.0909 (closing of yesterday's daily candle) to 1.0856, the 76.4% pullback level (red dotted line). When testing this level, an upward movement is possible with the target at 1.0930, the historical resistance level (blue dotted line).


