


Trend analysis (Fig. 1).
The pound-dollar pair may move upward from the level of 1.2049 (closing of Friday's daily candle) to 1.2107, the 14.6% pullback level (yellow dotted line). When this level is reached, continued upward movement is possible with the target of 1.2143, the 23.6% pullback level (yellow dotted line). When testing this level, the price may continue to move up.
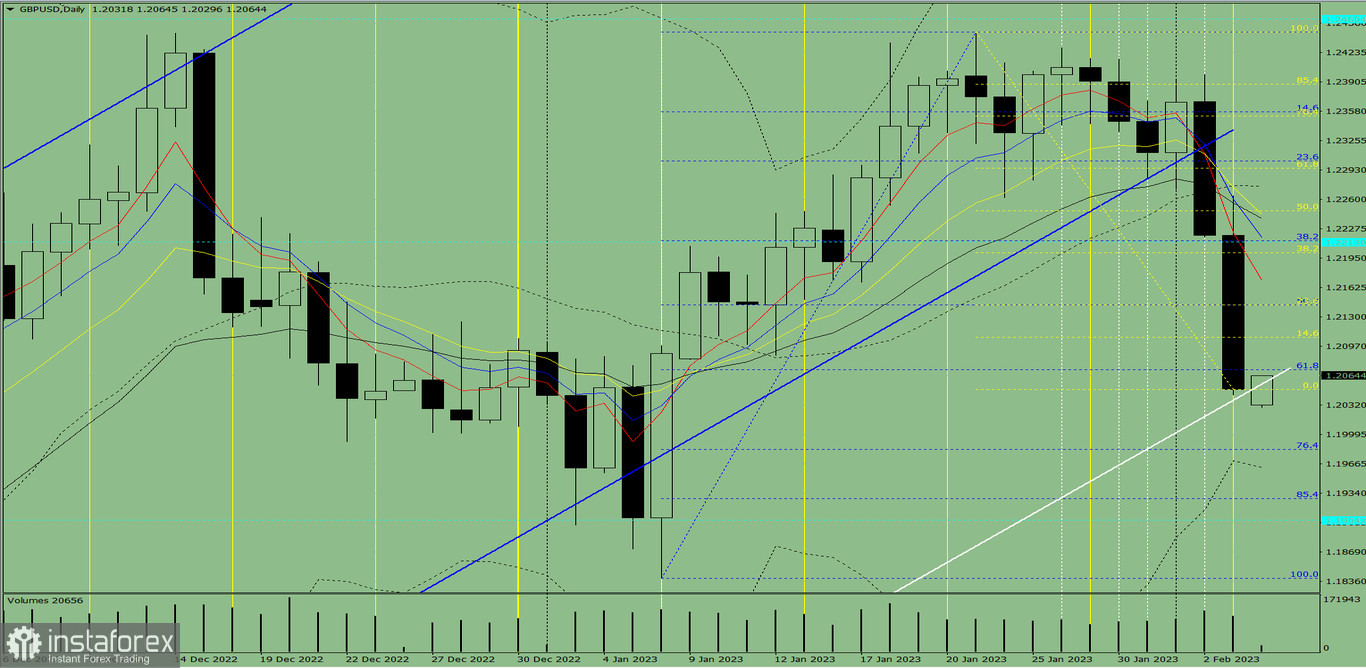
Fig. 1 (daily chart).
Comprehensive analysis:
- Indicator analysis - up;
- Fibonacci levels - up;
- Volumes - up;
- Candlestick analysis - up;
- Trend analysis - up;
- Bollinger bands - down;
- Weekly chart - up.
General conclusion:
Today, the price may move upward from the level of 1.2049 (closing of Friday's daily candle) to 1.2107, the 14.6% pullback level (yellow dotted line). When this level is reached, continued upward movement is possible with the target of 1.2143, the 23.6% pullback level (yellow dotted line). When testing this level, the price may continue to move up.
Alternatively, the price may move upward from the level of 1.2049 (closing of Friday's daily candle) to 1.2107, the 14.6% pullback level (yellow dotted line). When testing this level, the price may move down.


