Technical Market Outlook:
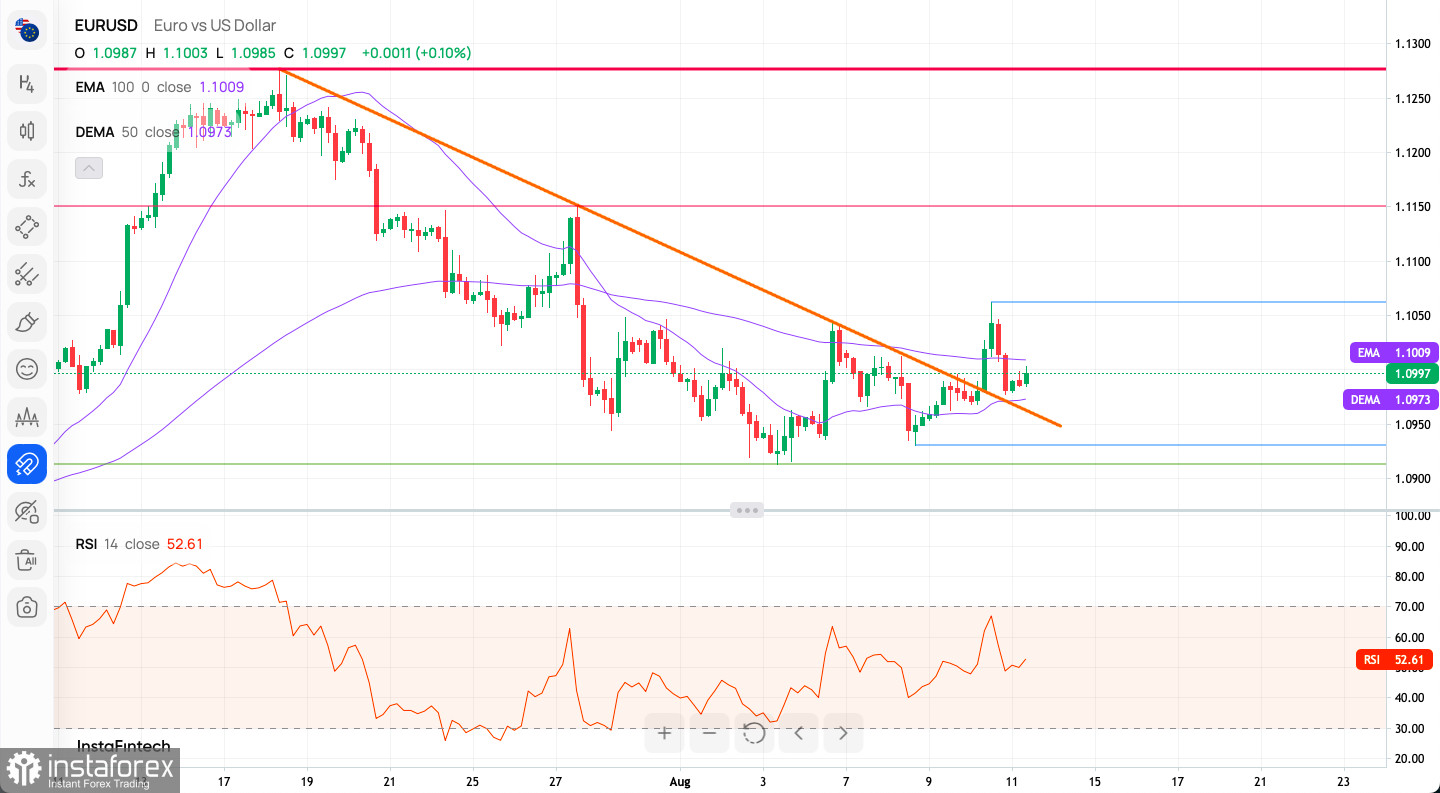
The EUR/USD pair has broken above the trend line resistance and above the intraday supply zone located between the levels of 1.1028 - 1.1043 and made a local high at the level of 1.1062. Despite the breakout above the supply zone, the market rally was capped and the bears pushed the price back towards the trend line support, which is being test now. The reversal confirmation comes with the level of 1.1150 breakout, so the bulls need to bounce from the current levels and rally again, way above the 1.1028 - 1.1043 zone. Please keep an eye on the momentum on the H4 time frame chart as it is hovering around the neutral level of 50 on the RSI (14) after hitting the extremely overbought conditions on the H4 time frame chart.

Weekly Pivot Points:
WR3 - 1.10716
WR2 - 1.10306
WR1 - 1.10088
Weekly Pivot - 1.09896
WS1 - 1.09678
WS2 - 1.09486
WS3 - 1.09076
Trading Outlook:
Since the beginning of October 2022 the EUR/USD is in the corrective cycle to the upside, but the main, long-term trend remains bearish. This corrective cycle might be terminated at the level of 1.1286 which is 61% Fibonacci retracement level when it is hit, so please keep an eye on this level and the way the market participants (bulls and bears) will deal with it.


