


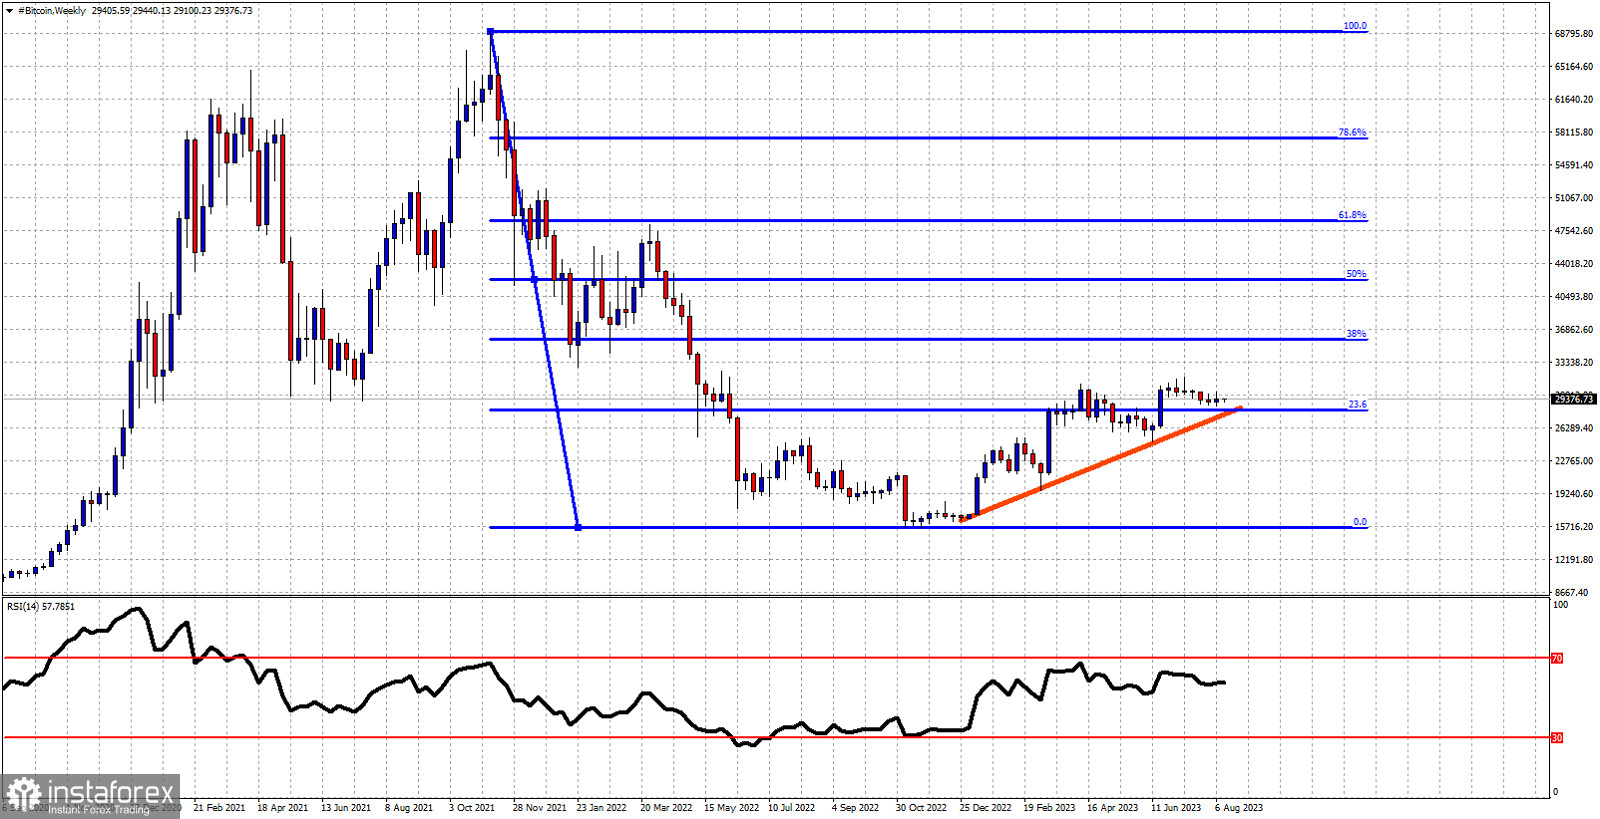
Red line - support trend line
Blue lines- Fibonacci retracement levels
Bitcoin continues to trade sideways around the $30,000 price level as it has been doing for the last 5 months. Price is stuck around the 23.6% Fibonacci retracement of the decline from its all time highs. At the same time price continues to respect the red upward sloping support trend line. Holding above this trend line is key, as it gives hopes for another move higher. Breaking above the $31,000 resistance area will open the way for a move towards the next major Fibonacci retracement level at $35,700. Failure to hold above the red trend line would be a bearish sign. Support by the red trend line is found at $27,900. As long as we trade above this level, we prefer bullish positioning.


