


Overview of trading on Friday
30-minute chart of GBP/USD
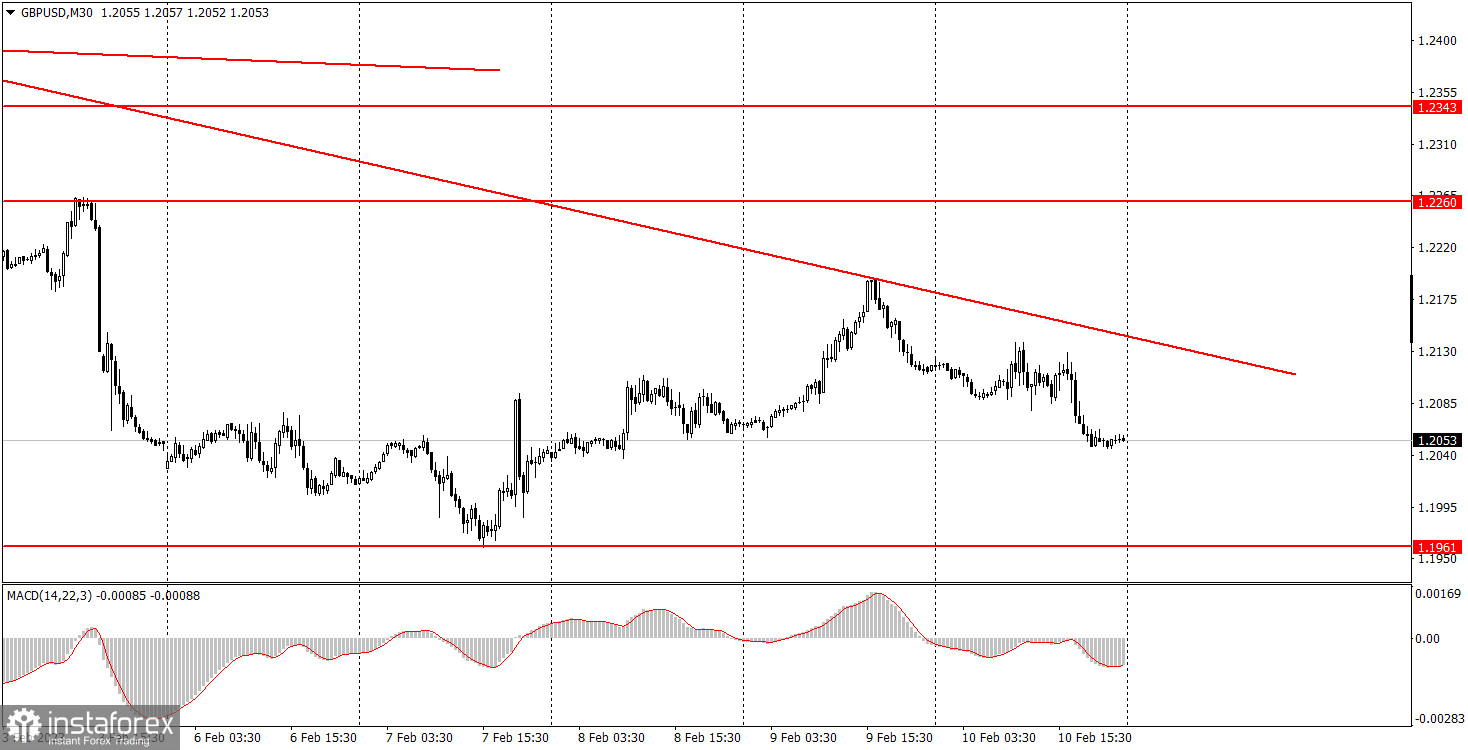
GBP/USD was also trading lower on Friday. There was an opportunity to form a descending trend line, so now we have a very good target. The first bearish target is 1.1961, which was the last local low. I don't think the pound will overcome it, so the British currency will continue to fall for several weeks. There was quite an important report on Friday, which can be treated in a different way. On the one hand, the British economy grew by 0% in the fourth quarter, which is completely in line with experts' forecasts. On the other hand, the positive value of the previous quarter was revised down to -0.2%. In general, we can say that it was a weak report. The British pound almost had no reaction to it since the pair started to fall later on. The industrial production report was slightly better than the forecasts; however, it had no effect on the pair's decline as well. GBP remains quite overbought since it rose by 2100 points in just a few months in 2022. We are waiting for the pound to fall further.
5-minute chart of GBP/USD
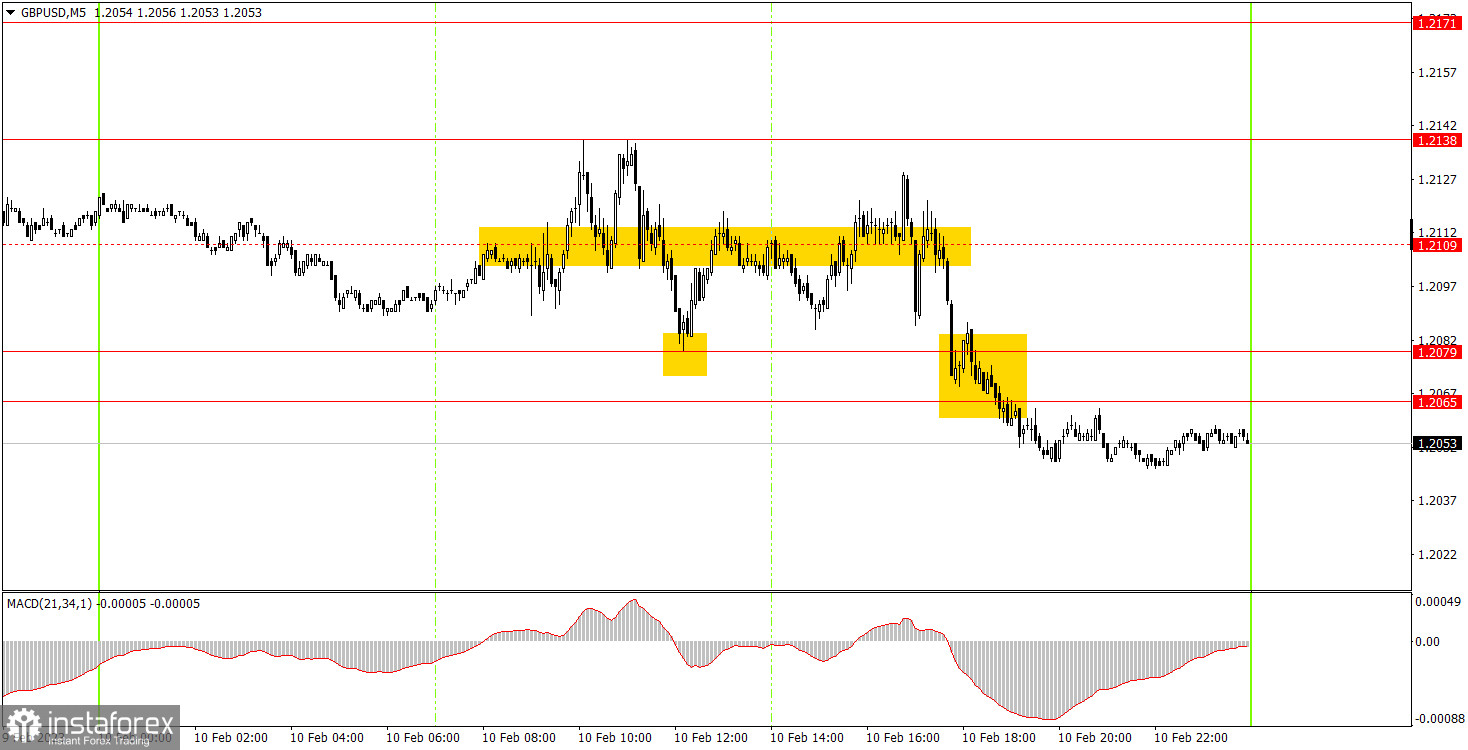
The 5-minute chart perfectly shows the nature of the pair's movement for most of Friday. It is a "swing" or flat. So it is not surprising that a great number of false signals were formed near 1.2109, which was considered irrelevant by the end of the day. Basically, beginners could price any of the two. The pair managed to reach the "target" level just once, which was 17 pips away from 1.2109. Therefore, it was very difficult to trade. The ideal solution would have been to not open positions, but it was quite difficult to identify the flat at the European trading session. Therefore, most likely, beginners opened one or two positions and managed to set the Stop Loss at breakeven on one of them. Therefore, you could only lose on one trade, and it was a small one.
Trading tips for Monday
On the 30-minute chart, GBP/USD has completed the bullish correction, so the pound may continue to fall to 1.1961. I believe that it will fall below this level since there is no reason for the pound to grow at the moment. The market has already worked out all of the bullish factors. On the 5-minute chart, it is recommended to trade at the levels 1.1950-1.1957-1.1961, 1.2065-1.2079, 1.2138, 1.2171-1.2179, 1.2245-1.2260, 1.2337-1.2343. As soon as the price passes 20 pips in the right direction, you should set a Stop Loss to breakeven. Nothing interesting planned for the UK and the US on Monday. Although, you should bear in mind that the US inflation report will be released on Tuesday. According to forecasts, the indicator may start to show signs of easing, so we expect a strong reaction from the market.
Basic rules of the trading system:
1) The strength of the signal is determined by the time it took the signal to form (a rebound or a breakout of the level). The quicker it is formed, the stronger the signal is.
2) If two or more positions were opened near a certain level based on a false signal (which did not trigger a Take Profit or test the nearest target level), then all subsequent signals at this level should be ignored.
3) When trading flat, a pair can form multiple false signals or not form them at all. In any case, it is better to stop trading at the first sign of a flat movement.
4) Trades should be opened in the period between the start of the European session and the middle of the US trading hours when all positions must be closed manually.
5) You can trade using signals from the MACD indicator on the 30-minute time frame only amid strong volatility and a clear trend that should be confirmed by a trendline or a trend channel.
6) If two levels are located too close to each other (from 5 to 15 pips), they should be considered support and resistance levels.
On the chart:
Support and Resistance levels are the levels that serve as targets when buying or selling the pair. You can place Take Profit near these levels.
Red lines are channels or trend lines that display the current trend and show in which direction it is better to trade now.
The MACD indicator (14, 22, and 3) consists of a histogram and a signal line. When they cross, this is a signal to enter the market. It is recommended to use this indicator in combination with trend patterns (channels and trendlines).
Important announcements and economic reports that can be found on the economic calendar can seriously influence the trajectory of a currency pair. Therefore, at the time of their release, we recommend trading as carefully as possible or exiting the market in order to avoid sharp price fluctuations.
Beginners on Forex should remember that not every single trade has to be profitable. The development of a clear strategy and money management is the key to success in trading over a long period of time.


