Technical analysis of EUR/USD and GBP/USD on February 14
EUR/USD

Larger timeframes
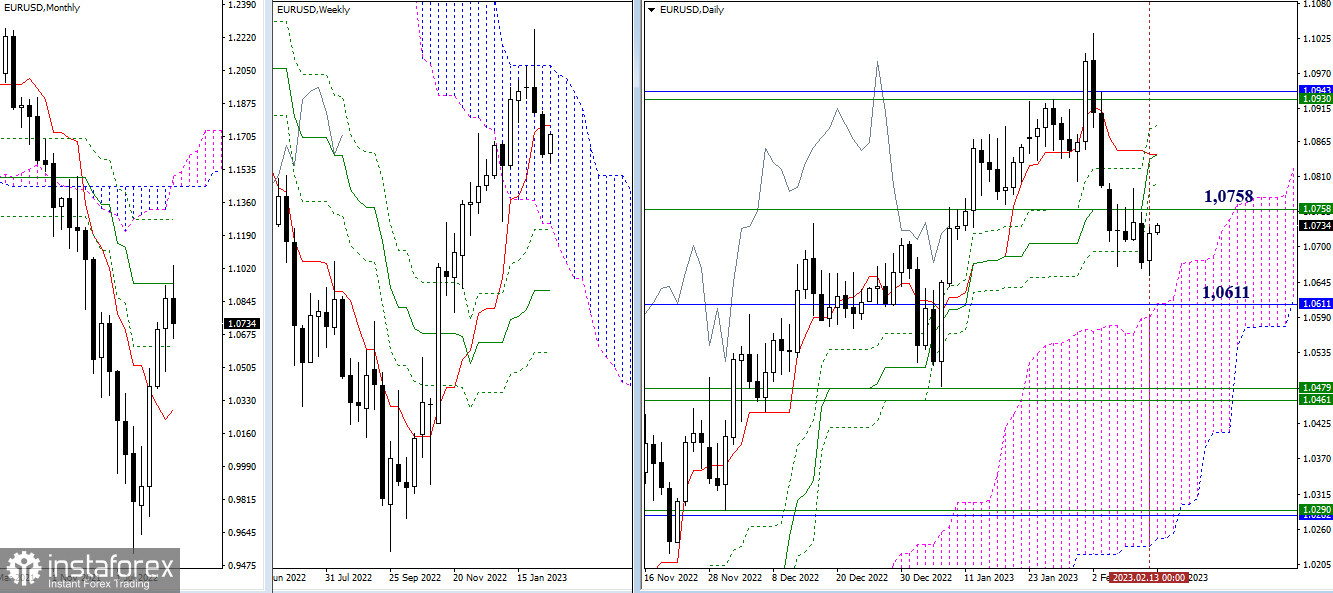
On the first day of the trading week, the euro bears again gave in to the bulls. As a result, EUR/USD returned to the zone of the previous consolidation. The overall technical picture and the targets identified earlier remain the same. The bulls are focused on the defence of the resistance borders such as 1.0758 (a one-week short-term trend), 1.0844 (the daily Cross) and 1.0933-43 (the upper border of the one-week cloud + a one-month medium-term trend). The bears aim to defend the following support levels: 1.0611 (the upper border of the daily cloud + a one-month level) and 1.0461-79 (the lower border of a one-week cloud + a one-week Fibo Kijun).

H4 – H1
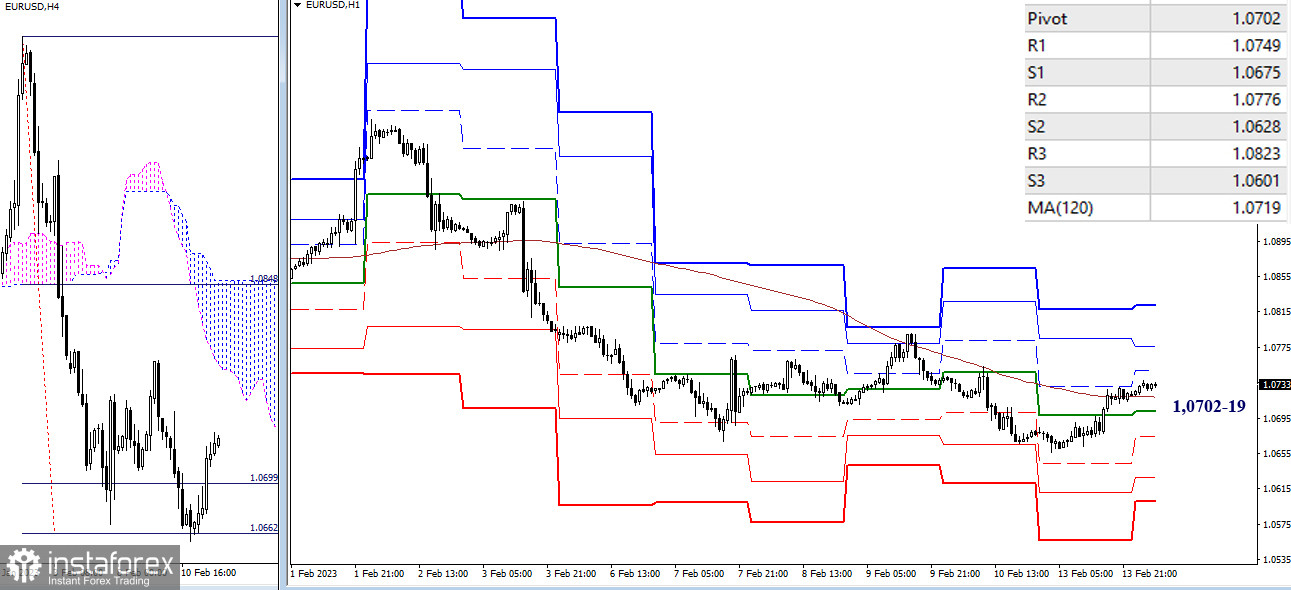
The 4-hour cloud has been broken at 1.0662. So, the target has been hit. This price action halted a down move and enabled a correctional climb. The bulls managed to take over the levels of the smaller timeframes. Therefore, the euro bulls are setting the tone now. The support levels at 1.0702-19 (the central pivot level + a one-week long-term trend) serve as the key levels today. A breakout of the key levels will influence the balance of trading forces. If the bulls manage to protect these key levels and push the price higher, the next upward intraday targets will be the resistance of classic pivot levels such as 1.0749 – 1.0776 – 1.0823.
***
GBP/USD

Larger timeframes
Traders remain in limbo like in the previous week. Uncertainty didn't allow the bears to develop a decline and pushed GBP/USD back to the support zone of a one-week short-term trend (1.2144). Here are the resistance levels from lower to higher, spotted on various timeframes: 1.2180 – 1.2203 – 1.2261 – 1.2302 – 1.2373. Once all these levels are passed and the price settles higher, the bulls will be able to insist on a further uptrend.

H4 – H1
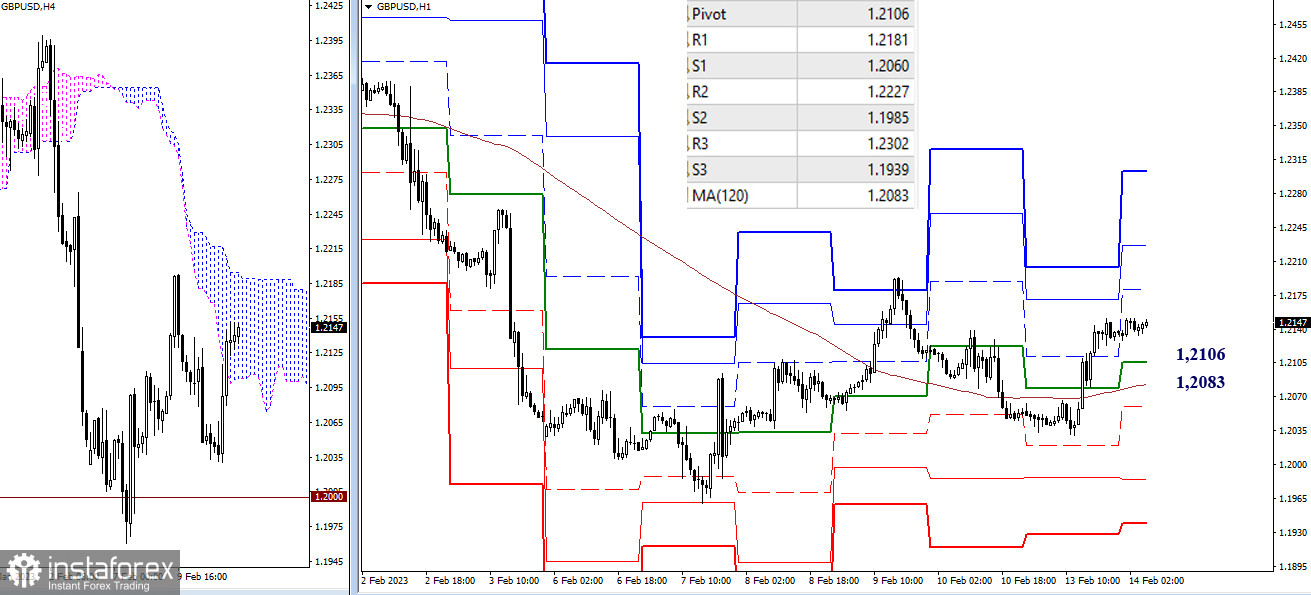
At present, the bulls are taking the lead on smaller timeframes. The bulls are focused on the following key levels: 1.2106 (the central intraday pivot level) and 1.2083 (a one-week long-term trend). A further climb will reinforce the bullish sentiment. The upward intraday target levels are seen as the resistance of classical pivot levels such as 1.2181 – 1.2227 – 1.2302. If the bulls lose the key levels 1.2106 and 1.2086, this will change the balance of trading forces. So, support levels of classic pivot levels 1.2060 – 1.1985 – 1.1939 will act as downward targets.
***
This technical analysis is based on the following ideas:
Larger timeframes - Ichimoku Kinko Hyo (9.26.52) + Fibo Kijun levels
H1 – classic pivot points + 120-period Moving Average (weekly long-term trendline)


