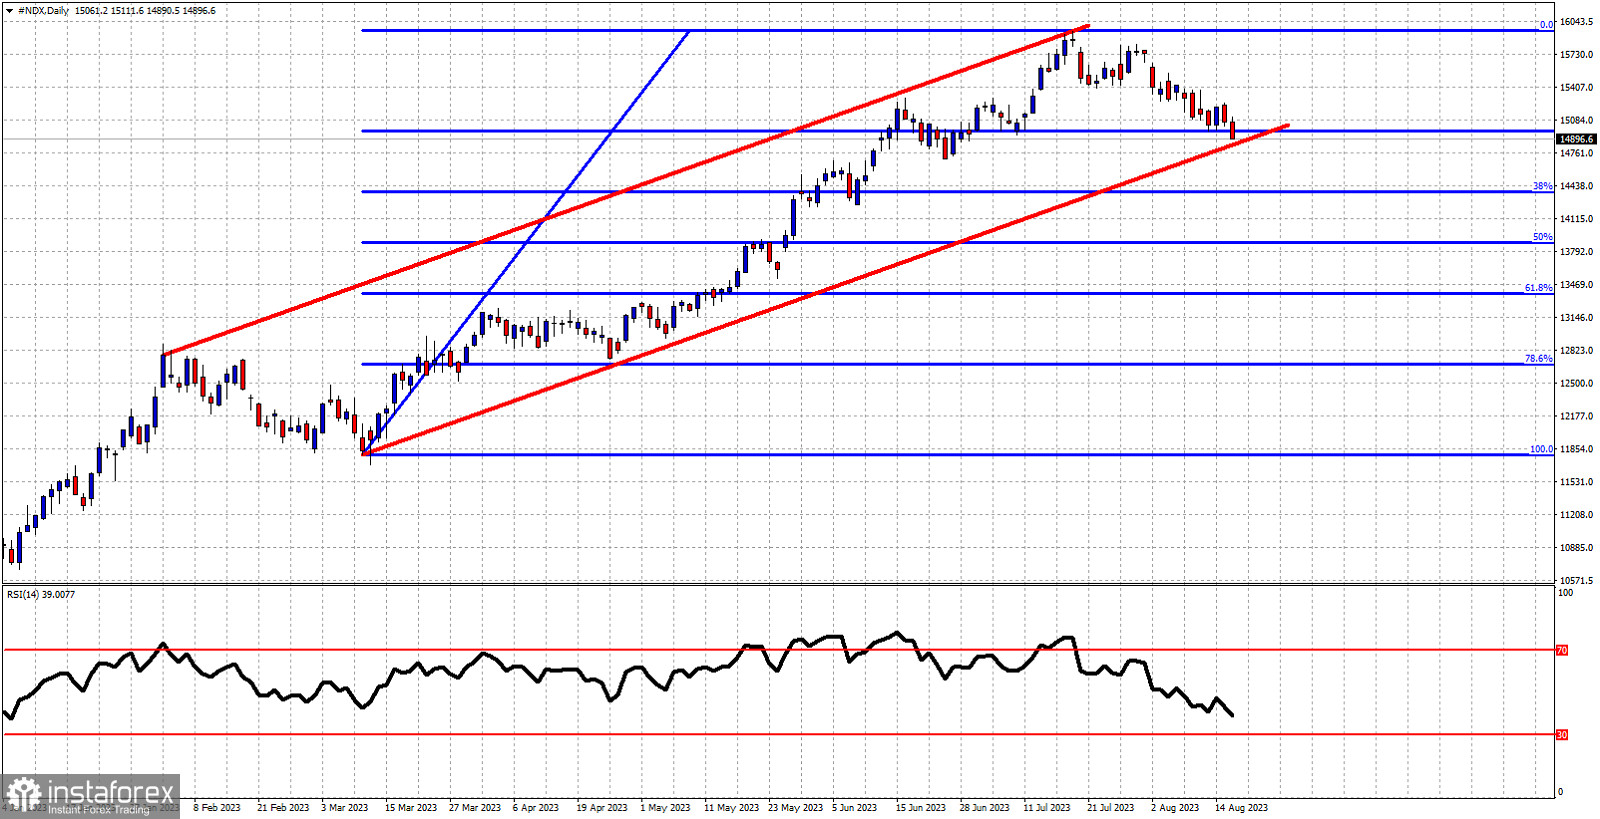
Red lines- bullish channel
Blue lines- Fibonacci retracement levels
In our previous analysis on NASDAQ we noted the bearish sentiment and the bearish short-term trend it was in. Our view was for NASDAQ to continue lower towards the lower channel boundary and the 14,980 price level. Today NASDAQ closed below 14,900. Price is approaching the important channel boundary support below the 23.6% Fibonacci retracement. If price breaks below the bullish channel we should expect NASDAQ to move even lower towards the 38% Fibonacci retracement at 14,370. The RSI is negatively sloped making lower lows and has still not reached oversold levels. The next couple of sessions as are very critical. Will we see a bigger decline? or will price bounce off channel support?


