


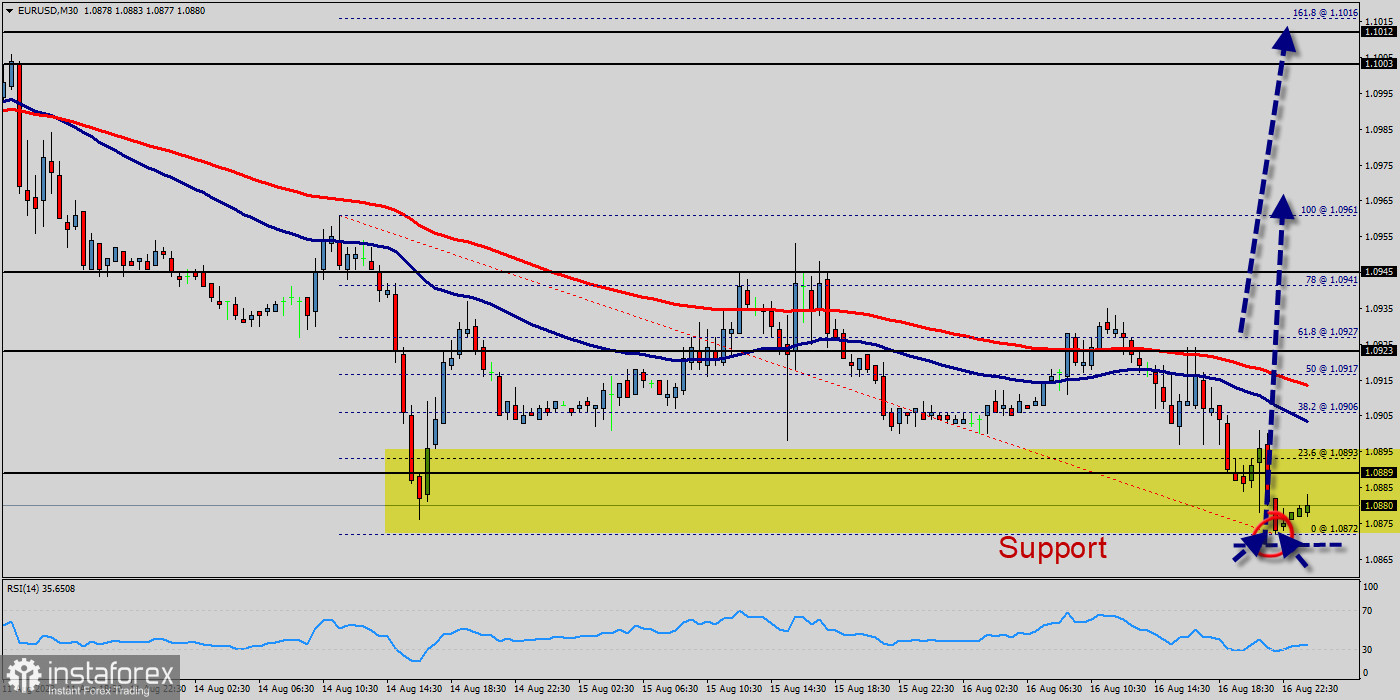
Overview :
It should be noted that volatility is very high for that the EUR/USD pair is still moving between 1.0923 and 1.1012 in coming hours. Furthermore, the price has been set above the strong support at the levels of 1.0923 and 1.0889, which coincides with the 61.8% and 38.2% Fibonacci retracement level respectively.
Bullish outlook :
That said, there was some positive economic news earlier Monday, with French industrial production rising 1.2% on the month in May, considerably stronger than the fall of 0.2% expected. Additionally, the price is in a bullish channel now. Amid the previous events, the pair is still in an uptrend. From this point, the EUR/USD pair is continuing in a bullish trend from the new support of 1.0923.
The outlook is turning positive for the Euro after the EUR/USD pair rose above the 50-day SMA. Technical indicators in the daily chart point to the upside, with the Relative Strength Index (RSI) moving south breaking under 40. Together with the price above the 50-day SMA, this offers a bullish signal.
The positive tone will ease if the Euro manages to post a daily close above 1.1003. Right now, the EUR/USD pair trades below 1.0973 following Thursday's choppy action. An upbeat US jobs report could cause the pair to push lower. 1.0924 stays intact as the next key technical support.
Looking at the EURUSD's chart, we can see that the forex pair is currently traded at the rate of 1.0973 after yesterday's swing. Resume the up trend. Today, it is testing its resistance level at around 1.0973, and if it can pass that level then we could expect it to rise further towards the next resistance level which is located at around the rate of 1.1012.
Decisive break there will confirm resumption of whole up trend from 1.0971. In the near term, and according to the one-hour chart, the risk skews to the upside. On the hourly chart, the EUR/USD pair is testing the strength of the support - the moving average line MA (100) H1 (1.1000). The EUR/USD pair is still above the MA 50 H1 line.
Based on the foregoing, it is probably worth sticking to the north direction in trading, and as long as the EUR/USD pair remains above MA 50 H1, it may be necessary to look for entry points to buy at the end of the correction.
Alternative scenario :
On the downside, the 1.1012 level represents support. The next major support is located near the 1.1012, which the price may drift below towards the 1.0945 support region. The volatility is very high for that the EUR/USD pair is still moving between 1.0900 and 1.1012 in coming hours. The bulls must break through 1.1012 in order to resume the up trend.


