


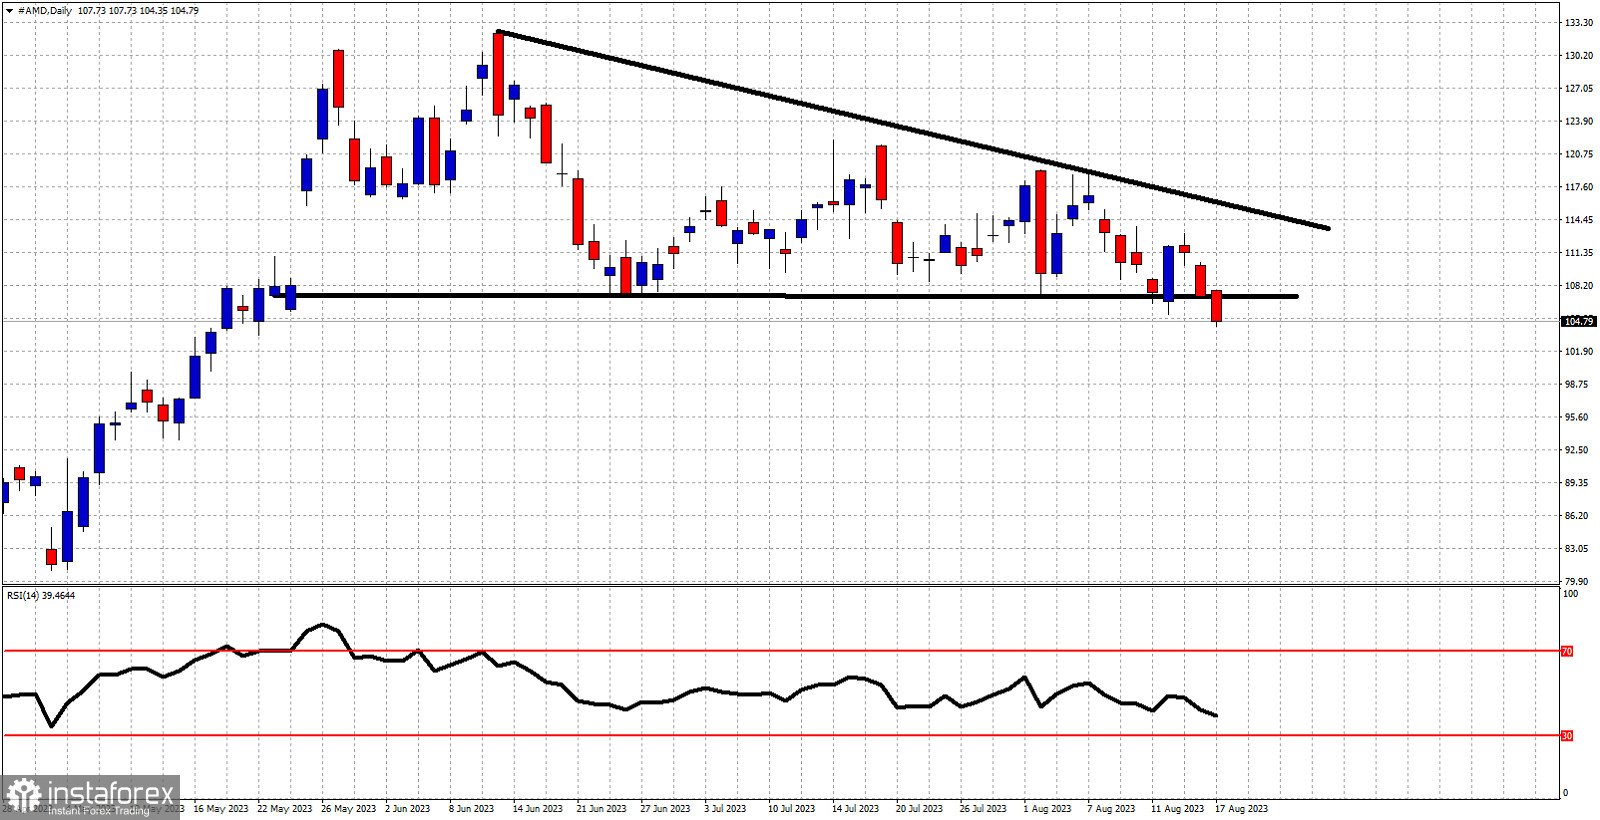
Black lines- descending triangle
AMD stock price is currently trading around $104.86. After today's market open, AMD's stock price is providing us with a bearish signal as price is breaking down below the lower triangle boundary of the descending triangle pattern it was in. Price not only makes a new lower low, but it also breaks the horizontal support of $107. This is an important bearish signal. In order for this bearish signal to be cancelled we need to see a daily close at least above $107 today. Resistance is at $113.20 and bulls will need to recapture this level in order to reclaim control of the trend. Downside potential for AMD stock price is now at $99.60. Our second target is at $91 and our third target at $82.


