


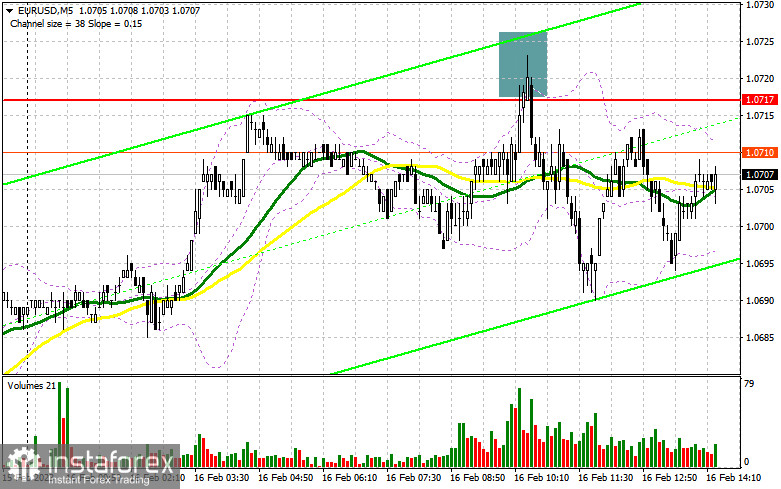
In my morning article, I turned your attention to 1.0717 and recommended making decisions with this level in focus. Now, let's look at the 5-minute chart and figure out what actually happened. A rise and a false breakout of this level created an excellent entry point into short positions in the continuation of the bear market. However, a large sell-off. did not occur. After a 20-pip decline, the euro rebounded. For the afternoon, the technical outlook remained the same.
When to open long positions on EUR/USD:
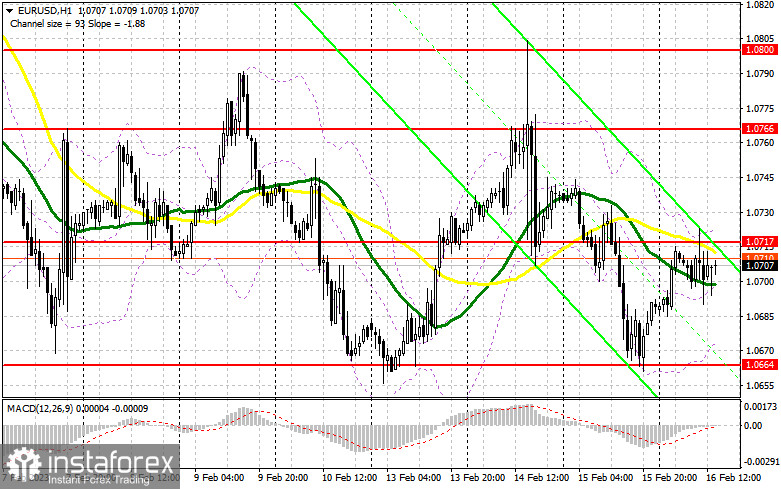
The US is going to reveal a batch of macroeconomic reports, which could again boost the US dollar. Initial jobless claims, the Producer Price and the Philadelphia Fed Manufacturing Indices will hardly have a great impact on the greenback. Dollar bulls will take notice of the US building permits and housing starts reports. If the readings climb, the pair is likely to drop to weekly lows. The speeches of Fed policymakers James Bullard and Loretta Mister could also facilitate its further fall. For this reason, the pressure on the pair persists, which is quite likely in the current market conditions, one should pay attention to 1.0664 - the lower border of the sideways channel. EUR/USD has already rebounded twice from this level. Only after a false breakout of 1.0664, I would advise you to go long. The pair could recover to the resistance level of 1.0717 formed yesterday. A breakout and a downward retest of this level in the afternoon will give an entry point into long positions with a jump to 1.0766. A breakout of 1.0766 will force bears to close their Stop Loss orders. It may generate a buy signal with the likelihood of climbing to 1.0800 where I recommend locking in profits. If EUR/USD declines and buyers show no activity at 1.0664 during the American session, the bearish trend will remain intact. In this case, traders should shift their attention to the support level of 1.0601. Only a false breakout of this level will provide a new buying opportunity. You could buy EUR/USD at a bounce from a low of 1.0565 or 1.0525, keeping in mind an upward intraday correction of 30-35 pips.
When to open short positions on EUR/USD:
As long as trading is carried out below 1.0717, a further decline looks likely. In the event of an upward movement after the US reports, only a false breakout of 1.0717 may give a sell signal with the prospect of correction to 1.0664 – the lower border of the sideways channel. It will be rather hard to break out of this range. A breakout and an upward retest of this level amid the hawkish rhetoric of Fed policymakers could create a sell signal with a slide to 1.0601. It will surely strengthen bearish sentiment. A drop below will occur only amid strong US macros stats. It will cause a more significant decrease to 1.0565. At this level, I recommend locking in profits. If EUR/USD rises during the US session and bears show no energy at 1.0717, which is more likely than in the morning, the bulls will try to take the upper hand. In this case, I advise you to postpone short positions until a false breakout of 1.0766. You could sell EUR/USD for a rebound from a high of 1.0800, keeping in mind a downward intraday correction of 30-35 pips.
COT report
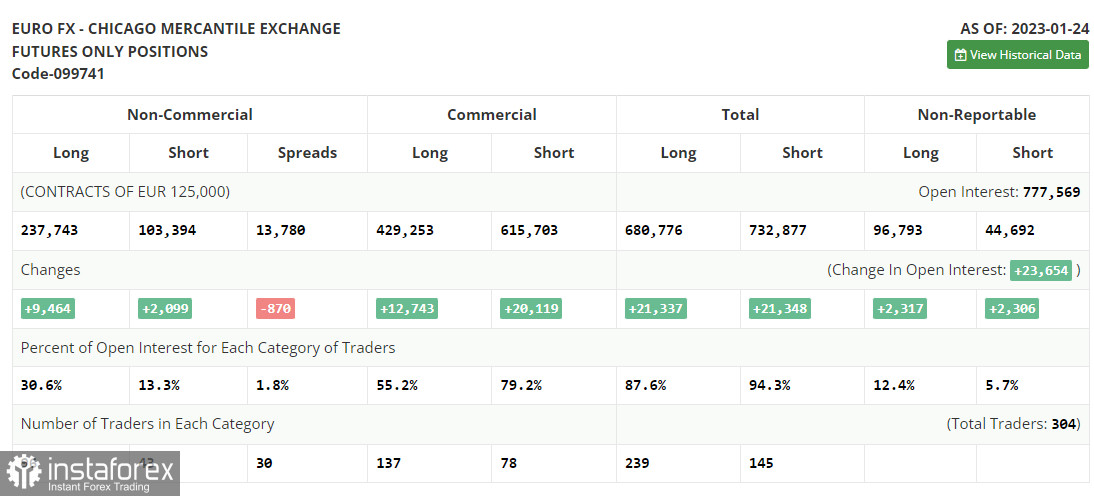
Due to a technical failure of the CFTC that has been going on for more than two weeks, new COT reports continue to be delayed. The most recent data was published on January 24.
The COT report for January 24 logged a rise in both short and long positions. Traders have significantly increased long positions following hawkish speeches of ECB policymakers. They are betting on further monetary tightening by the ECB and the Fed's dovish stance. The US regulator may reduce the pace of tightening for the second time in a row. Weak macro stats on the US economy, namely a drop in retail sales and a slowdown in inflation may force the central bank to take a pause in rate hikes to avoid any damage. This week, several central banks will hold their meetings. Their results will eventually determine the trajectory of the euro/dollar pair. According to the COT report, the long positions of the non-commercial group of traders increased by 9,464 to 237,743 while short positions advanced by 2,099 to 103,394. At the end of the week, the total non-commercial net position rose to 134,349 from 126,984. It appears investors believe in the upside potential of the euro. Nevertheless, they are waiting for more clues from central banks regarding interest rates. The weekly closing price grew to 1.0919 from 1.0833.
Indicators' signals:
Trading is carried out near the 30 and 50 daily moving averages, which indicates market uncertainty.
Moving averages
Note: The period and prices of moving averages are considered by the author on the H1 (1-hour) chart and differ from the general definition of the classic daily moving averages on the daily D1 chart.
Bollinger Bands
If EUR/USD declines, the indicator's lower border at 1.0697 will act as support.
Description of indicators
- Moving average (moving average, determines the current trend by smoothing out volatility and noise). Period 50. It is marked yellow on the chart.
- Moving average (moving average, determines the current trend by smoothing out volatility and noise). Period 30. It is marked green on the chart.
- MACD indicator (Moving Average Convergence/Divergence - convergence/divergence of moving averages) Quick EMA period 12. Slow EMA period to 26. SMA period 9
- Bollinger Bands (Bollinger Bands). Period 20
- Non-commercial speculative traders, such as individual traders, hedge funds, and large institutions that use the futures market for speculative purposes and meet certain requirements.
- Long non-commercial positions represent the total long open position of non-commercial traders.
- Short non-commercial positions represent the total short open position of non-commercial traders.
- Total non-commercial net position is the difference between the short and long positions of non-commercial traders.


