


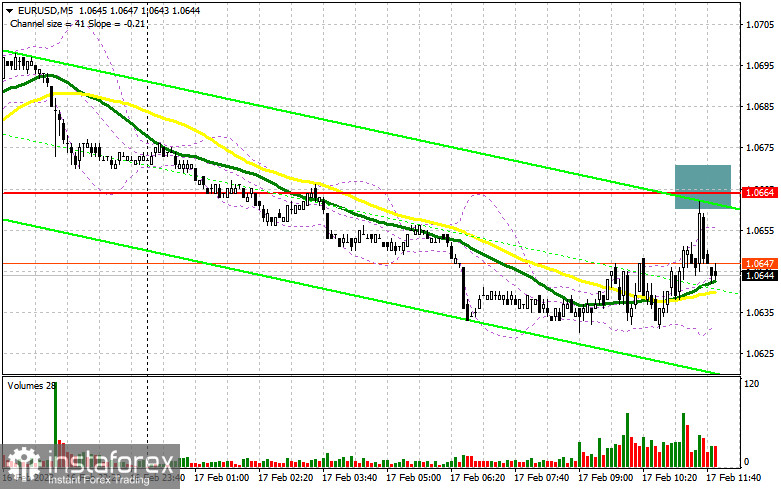
In my morning forecast, I focused on the level of 1.0664 and offered recommendations based on it for market entry decisions. Let's analyze the 5-minute chart to see what happened. Although there was growth in the area of 1.0664, only a few points were sufficient to prevent the development of a false breakout at this level. I refused to sell because there was nowhere to place a stop order, and the euro then dropped sharply. The technical picture barely changed during the second half of the day.
For EUR/USD long positions, the following is required:
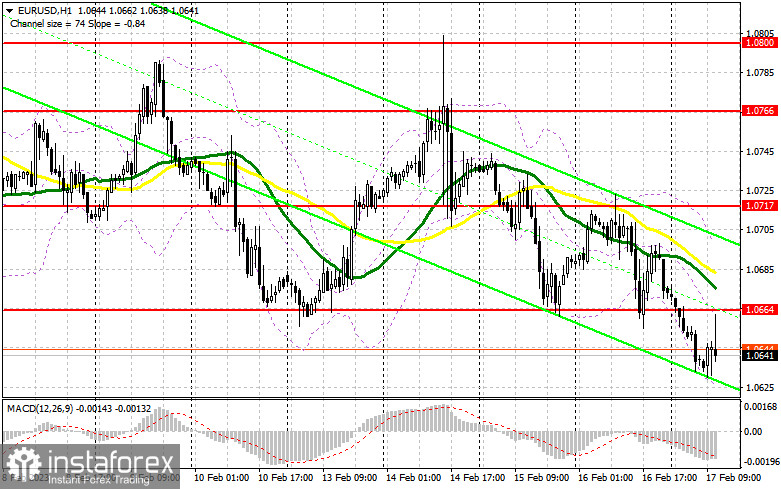
The euro still has a chance to break through and update weekly lows in the afternoon when Michelle Bowman and Thomas Barkin, two members of the Federal Reserve System, speak in addition to data on the import price index and the index of unimportant leading indicators. The necessity for higher interest rates to bring inflation back to normal levels would likely continue to be discussed by FOMC members, which may theoretically support the dollar and put pressure on the euro. For this reason, I will wager on a new low of 1.1610, which was slightly revised from the morning forecast, while sustaining pressure on the pair, which is very visible in the current conditions. They won't purchase euros until a false breakout occurs, at which point they will attempt to rise to the resistance level of 1.0664, which we failed to reach during European trading. An additional entry point for developing long positions with a movement to 1.0717 would be formed by a breakout and top-down test of this range in the afternoon. The stop orders will be hit by the breakout of 1.0717, providing a second signal with the potential to move to 1.0866, where I will fix the profit. The pressure on EUR/USD will stay if it lowers and there are no buyers at 1.0602 in the afternoon; a break of this level would only make the bearish trend stronger. In this situation, the emphasis will be on the following support level of 1.0565. The only indication to buy the euro will be the development of a false breakout. With an eye toward an upward corrective of 30-35 points during the day, I will begin long positions right now for a rebound from the minimum of 1.0525, or even lower - around 1.0484.
You need the following to open short positions on EUR/USD:
You may and should sell at 1.0664, but I'd prefer to see a more reasonable test of this range than the one that was conducted in the morning. The only way to be certain that there are significant players in the market and predict a new movement of the pair down to the 1.0610 level is if false breakout forms at 1.0664. An additional sell signal with an exit around 1.0565 will be formed if this range breaks down and is reversed, which will occur against the backdrop of more hawkish Fed members' speeches and accentuate the market's bearish trend. Fixing below this range will result in a more dramatic drop to the level of 1.0484, where I will take profit. The bulls will try to return to the market if the EUR/USD moves higher during the US session against the backdrop of profit-taking after the week and the lack of bearishness above 1.0664, which is more likely. Consequently, as soon as the moving averages start to favor sellers slightly below the level of 1.0717, I suggest you delay opening short positions. Moreover, you can only sell there following a failed consolidation. In anticipation of a rebound from the high point of 1.0766, I will open short positions right away with a 30- to 35-point corrective in mind.
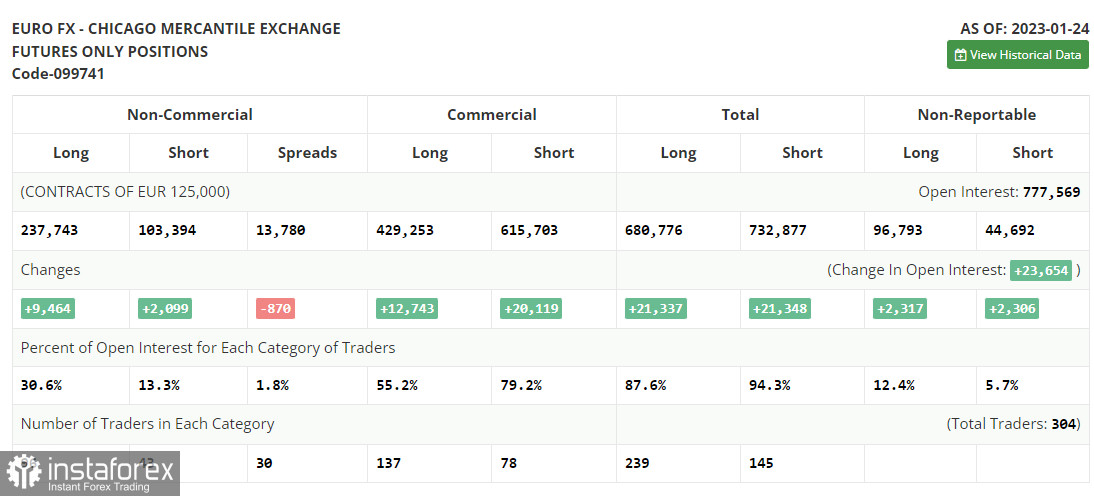
The CFTC has been experiencing a technical issue that has prevented the publication of new COT reports for more than two weeks. The most recent data is for January 24.
Both long and short positions increased as of January 24, according to the COT report (Commitment of Traders). The ECB representatives' speeches from last week had an impact on traders, who actively increased their long positions in anticipation of the ECB continuing its aggressive policy and the Federal Reserve System adopting a less aggressive stance that may, for the second time in a row, reduce the amount by which the rate will be raised. The thoroughly average basic statistics on the US economy, particularly the decline in retail sales and the slowing of inflationary pressure, indicate that it is time to ease off, as the Fed's continued tight monetary policy could further damage the economy. This week's schedule of central bank meetings will determine the pair's future course. The number of long non-commercial jobs increased by 9,464 to 237,743, while the number of short non-commercial jobs increased by 2,099 to 103,394. The total non-commercial net position rose to 134,349 from 126,984 toward the end of the week. All of this shows that investors are confident in the euro's future growth but are awaiting more information on interest rates from central banks. In contrast to 1.0833, the weekly ending price increased to 1.0919.
Signals from indicators
Moving Averages
Trade occurs in the vicinity of the 30 and 50-day moving averages, which suggests market volatility.
Note that the author's consideration of the period and costs of moving averages on the hourly chart H1 differs from the standard definition of the traditional daily moving averages on the daily chart D1.
Bands by Bollinger
The indicator's lower limit, which is located at 1.0697, will serve as support in the event of a decline.
Description of indicators
- Moving average (moving average determines the current trend by smoothing out volatility and noise). Period 50. The graph is marked in yellow.
- Moving average (moving average determines the current trend by smoothing out volatility and noise). Period 30. The graph is marked in green.
- MACD indicator (Moving Average Convergence / Divergence - moving average convergence/divergence) Fast EMA period 12. Slow EMA period 26. SMA period 9
- Bollinger Bands (Bollinger Bands). Period 20
- Non-profit speculative traders, such as individual traders, hedge funds, and large institutions, use the futures market for speculative purposes and to meet certain requirements.
- Long non-commercial positions represent the total long open position of non-commercial traders.
- Short non-commercial positions represent the total short open position of non-commercial traders.
- Total non-commercial net position is the difference between the short and long positions of non-commercial traders.


