


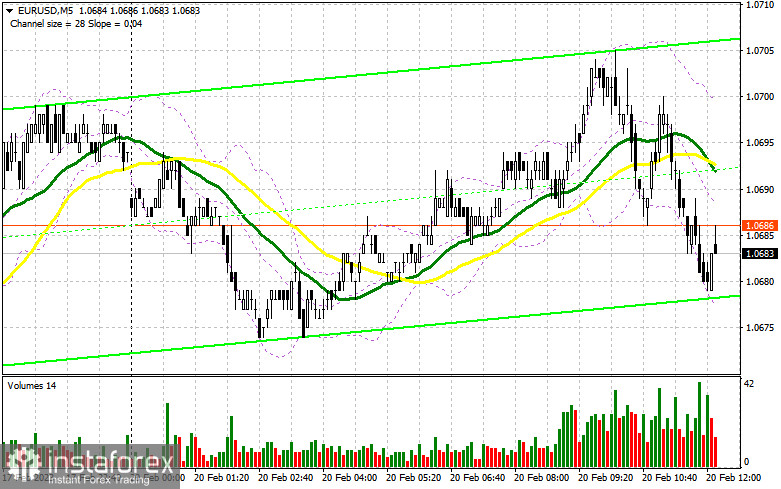
In my morning forecast, I focused on the level of 1.0664 and provided recommendations based on it for market entry decisions. Let's analyze the 5-minute chart to see what happened. We didn't accomplish the targets I mentioned because of the minimal trading volatility, and no signals were created. Both the technical picture and the technique were left unchanged for the rest of the day.
If you want to trade long positions on EUR/USD, you will need:
Due to Presidents' Day celebrations, today is a national holiday in the USA, and many markets, including the stock market, are closed. Thus, no basic numbers are anticipated today. I won't rely on the development of entry points in particular because of the extremely low volatility and trading volume that will continue to exist. I suggest taking your time when purchasing. The best course of action is to wait for an update on the nearest support level of 1.0664, where the moving averages are favoring buyers. I won't buy the euro until a false breakout forms there in hopes of pushing it past the resistance level of 1.0717, which will be difficult to overcome. In the absence of American statistics, a breakout and top-down test of 1.0717 provide an extra entry point for building up long positions with a movement to 1.0766, but it is unlikely that prices will rise over this level today. The bears' stop orders will be hit if we witness a collapse of 1.0766 since it will change the market and send out another signal with a potential move to 1.0800, where I will fix profits. The pressure on EUR/USD will stay if it lowers and there are no buyers at 1.0664 in the afternoon; a break of this level would only make the bearish trend stronger. In this instance, the subsequent support of 1.061 will be highlighted. By comparison with last Friday, only the development of a false breakout there will provide a buy signal for the euro. For a rebound from the low of 1.0565, or even lower - around 1.0525 - I will begin long positions right away with the target of an upward correction of 30-35 points during the day.
If you want to trade short positions on EUR/USD, you'll need:
Selling from 1.0717 is both possible and required, but the bears must act rather aggressively there in the afternoon. Many traders in the market will bet on the pair's further decline if a false breakout forms at the price of 1.0717. In this instance, I'm expecting a surge down to 1.0664. The market will become more negative if this range is broken and reversed, which would create another sell signal with an exit at 1.0615. A more dramatic decrease to the level of 1.0565, where I will take profit, will result from fixing below this range. If the EUR/USD rises during the US session and there are no bears below 1.0717, which is less likely, the bulls will keep entering the market. In this situation, I suggest delaying opening short positions until 1.0766. Moreover, you can only sell there following a failed consolidation. In anticipation of a reversal from the high of 1.0800, I will begin short positions right away with the target of a 30- to 35-point drop downward.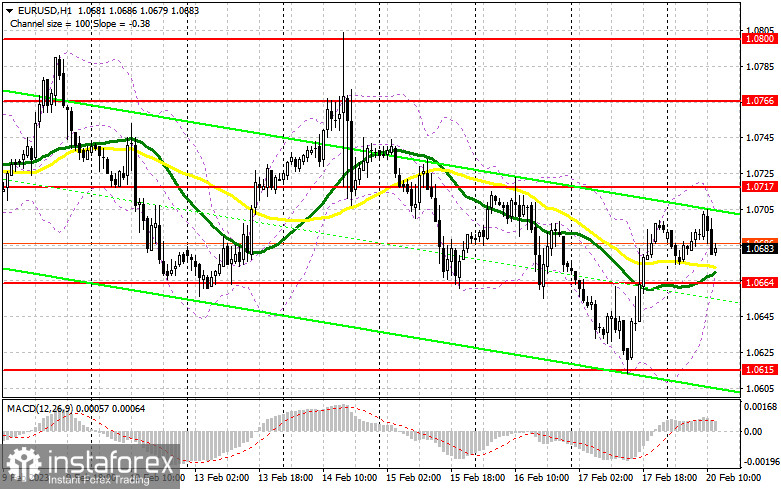
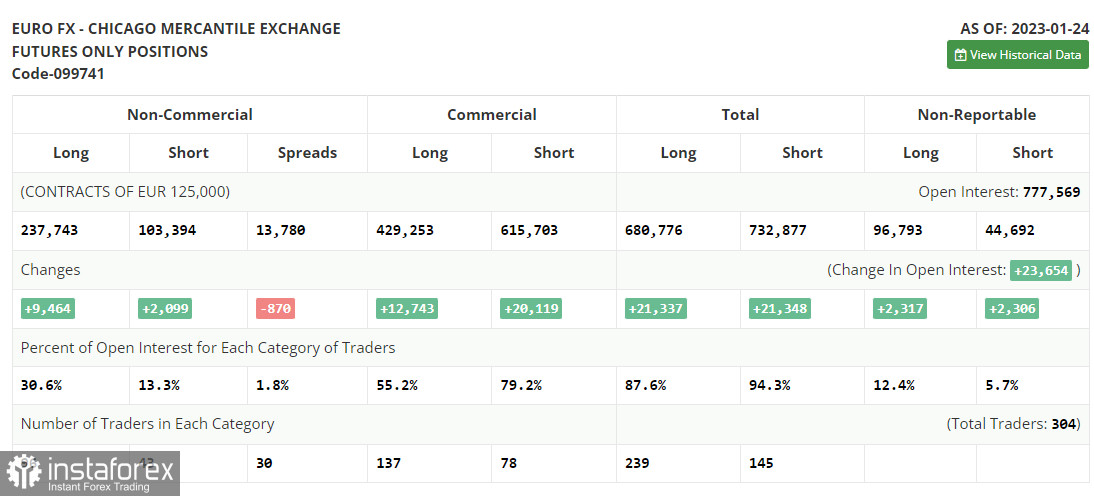
Due to a CFTC technical issue that has persisted for more than two weeks. The most recent COT reports have not yet been released. Following solely the January 24th data.
Both long and short positions increased as of January 24 according to the COT report (Commitment of Traders). The ECB representatives' speeches from last week had an impact on traders, who actively increased their long positions in anticipation of the ECB continuing its aggressive policy and the Federal Reserve System adopting a less aggressive stance that may, for the second time in a row, reduce the amount by which the rate will be raised. Recent weak fundamental indicators on the US economy, particularly the decline in retail sales and the easing of inflationary pressure, suggest that it is time to loosen up since the Fed's continued hawkish monetary policy could worsen the situation. This week's schedule of central bank meetings will determine the pair's future course. According to the COT report, long non-profit positions increased by 9,464 to reach 237,743, while short non-profit posts increased by 2,099 to reach 103,394. The total non-commercial net position rose to 134,349 from 126,984 towards the conclusion of the week. All of this shows that investors are confident in the euro's future growth but are awaiting more information on interest rates from central banks. In contrast to 1.0833, the weekly ending price increased to 1.0919.
Signals from indicators
Moving Averages
The fact that trading is taking place above the 30 and 50-day moving averages suggests that buyers are in the lead.
Notably, the author considers the time and prices of moving averages on the hourly chart H1 and departs from the standard definition of the traditional daily moving averages on the daily chart D1.
Bands by Bollinger
The indicator's lower limit, which is located around 1.0664, will serve as support in the event of a decline.
Description of indicators
- Moving average (moving average determines the current trend by smoothing out volatility and noise). Period 50. The graph is marked in yellow.
- Moving average (moving average determines the current trend by smoothing out volatility and noise). Period 30. The graph is marked in green.
- MACD indicator (Moving Average Convergence / Divergence - moving average convergence/divergence) Fast EMA period 12. Slow EMA period 26. SMA period 9
- Bollinger Bands (Bollinger Bands). Period 20
- Non-profit speculative traders, such as individual traders, hedge funds, and large institutions use the futures market for speculative purposes and to meet certain requirements.
- Long non-commercial positions represent the total long open position of non-commercial traders.
- Short non-commercial positions represent the total short open position of non-commercial traders.
- Total non-commercial net position is the difference between the short and long positions of non-commercial traders


