


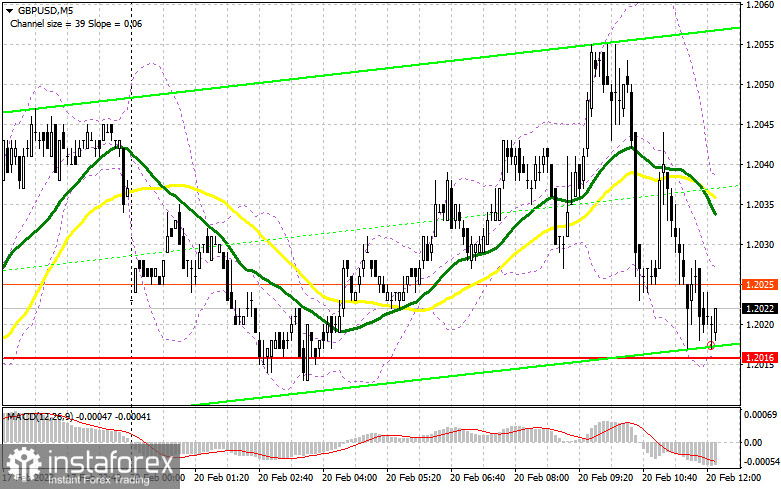
In my morning forecast, I focused on the 1.2016 level and offered advice based on it for trading decisions. Let's analyze the 5-minute chart to see what happened. We didn't accomplish the targets I mentioned because of the minimal trading volatility, and no signals were created. Both the technical picture and the technique were left unchanged for the rest of the day.
You require the following to open long positions on the GBP/USD:
Today is a holiday in the USA in observance of Presidents' Day, and several markets (including the stock market) are closed. Thus, no fundamental statistics are anticipated today. As a result, volatility and trading volume will stay exceedingly low, and I will not place a high value on the formation of entry points. As a result, purchasers of the pound have a good chance of continuing the upward correction after such a strong Friday rally. Under the circumstances, it would be preferable to wait for a decline and the emergence of a false breakout in the area of the nearest support at 1.2016, which is slightly below where the moving averages that are supporting the bulls are moving. This will serve as a signal to purchase the pound with the hope that it will strengthen to around 1.2070. I won't bet on the GBP/USD rate moving up to 1.2125 until it fixes and tests from top to bottom of this range. A pullback above this range will also bring growth prospects to 1.2178, where I've fixed profits. The bears will regain control of the market and put more pressure on GBP/USD if the bulls are unable to complete the duties assigned to them and miss 1.2016 in the afternoon. In this situation, I suggest against making hasty purchases and only starting long positions at the next support level of 1.1967 and only in the event of a false breakout. I'll buy GBP/USD right away only if it rises over the monthly low of 1.1919 with the intention of a correction of 30-35 points during the day.
You require the following to open short positions on the GBP/USD:
The pound is essentially being pushed into the area of the closest support on 1.2016 by sellers as they apply pressure over time. But, given that there won't be much trade today, it will probably be tough to break below 1.2016: at the very least, it will be impossible to tell whether there are any real players in the market or if everything is just speculation. As a result, maintaining the protection of the nearest resistance level of 1.2070 is still very important and would be a great indication to sell the pair at the moment. Growth and the formation of a false breakout there can trigger the opening of short positions and further decline of GBP/USD to the area of 1.2016, which must be brought back under control as soon as possible. A break and reverse test of this area will cancel out buyers' plans for an upward correction, reinforcing bears' position in the market and generating a sell signal with a fall below 1.1967. The 1.1919 area will be the farthest target, and an update there will signal the continuation of the downward trend. I will fix the profit there. Around 1.2070 in the afternoon, with the possibility of a GBP/USD rise and the lack of bears, bulls may continue to actively enter the market. I suggest that you take your time with sales and turn your attention to 1.2125. Only a false breakout creates an opening for short positions there. If there is no movement at this price, I will sell GBP/USD right away at the highest price of 1.2178, but only if I believe the pair will fall back by 30-35 points during the trading day.
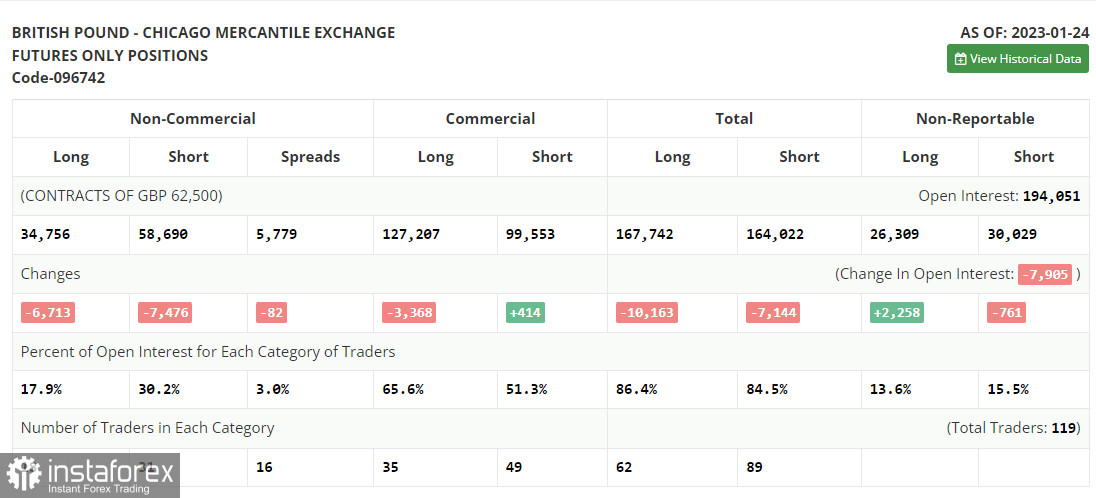
The CFTC has been experiencing a technical issue that has prevented the publication of new COT reports for more than two weeks. The most recent data is for January 24.
Both long and short positions were dramatically reduced in the COT report (Commitment of Traders) for January 24. But, given the difficulties the UK government is now facing, including dealing with strikes and demands for wage increases while also attempting to achieve a continuous fall in inflation, the recent reduction was within the acceptable threshold. Yet for the time being, all of this is receding into the background as we await the meetings of the Federal Reserve System, whose policy is anticipated to be less aggressive, and the Bank of England, whose pronouncements are certain to keep an aggressive tone by raising the rate by 0.5% once more. All of this will benefit the British pound, so unless something spectacular occurs, I'll rely on it strengthening even more. According to the most recent COT data, long non-commercial positions declined by 6,713 to 34,756 while short non-commercial positions decreased by 7,476 to 58,690, resulting in a fall in the non-commercial net position's negative value to -23,934 from -24,697 a week earlier. We will continue to keep a careful eye on the economic indicators for the UK and the decision made by the Bank of England because such insignificant changes do not significantly alter the balance of power. In contrast to 1.2290, the weekly ending price increased to 1.2350.
Signals from indicators
Moving Averages
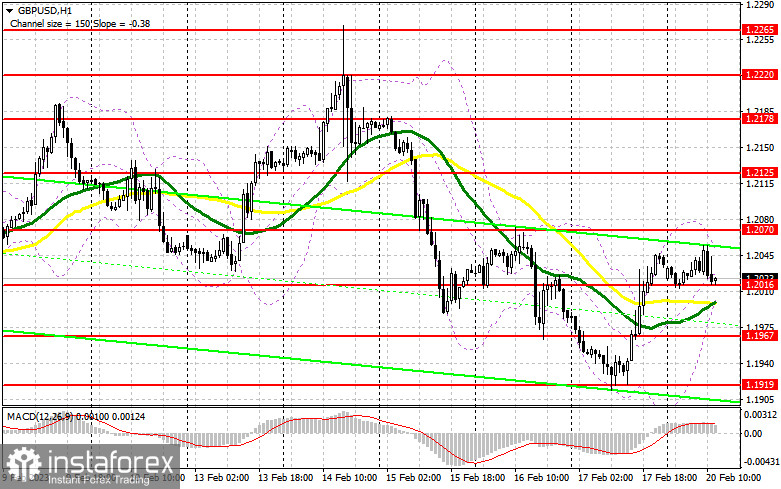
Trade is taking place above the 30 and 50-day moving averages, indicating an effort to draw back purchasers of the pound into the market.
Note that the author's consideration of the period and costs of moving averages on the hourly chart H1 differs from the standard definition of the traditional daily moving averages on the daily chart D1.
Bands by Bollinger
The indicator's upper limit, which is located at 1.2045, will serve as resistance in the event of growth.
Description of indicators
- Moving average (moving average determines the current trend by smoothing out volatility and noise). Period 50. The graph is marked in yellow.
- Moving average (moving average determines the current trend by smoothing out volatility and noise). Period 30. The graph is marked in green.
- MACD indicator (Moving Average Convergence / Divergence - moving average convergence/divergence) Fast EMA period 12. Slow EMA period 26. SMA period 9
- Bollinger Bands (Bollinger Bands). Period 20
- Non-profit speculative traders, such as individual traders, hedge funds, and large institutions use the futures market for speculative purposes and to meet certain requirements.
- Long non-commercial positions represent the total long open position of non-commercial traders.
- Short non-commercial positions represent the total short open position of non-commercial traders.
- Total non-commercial net position is the difference between the short and long positions of non-commercial traders.


