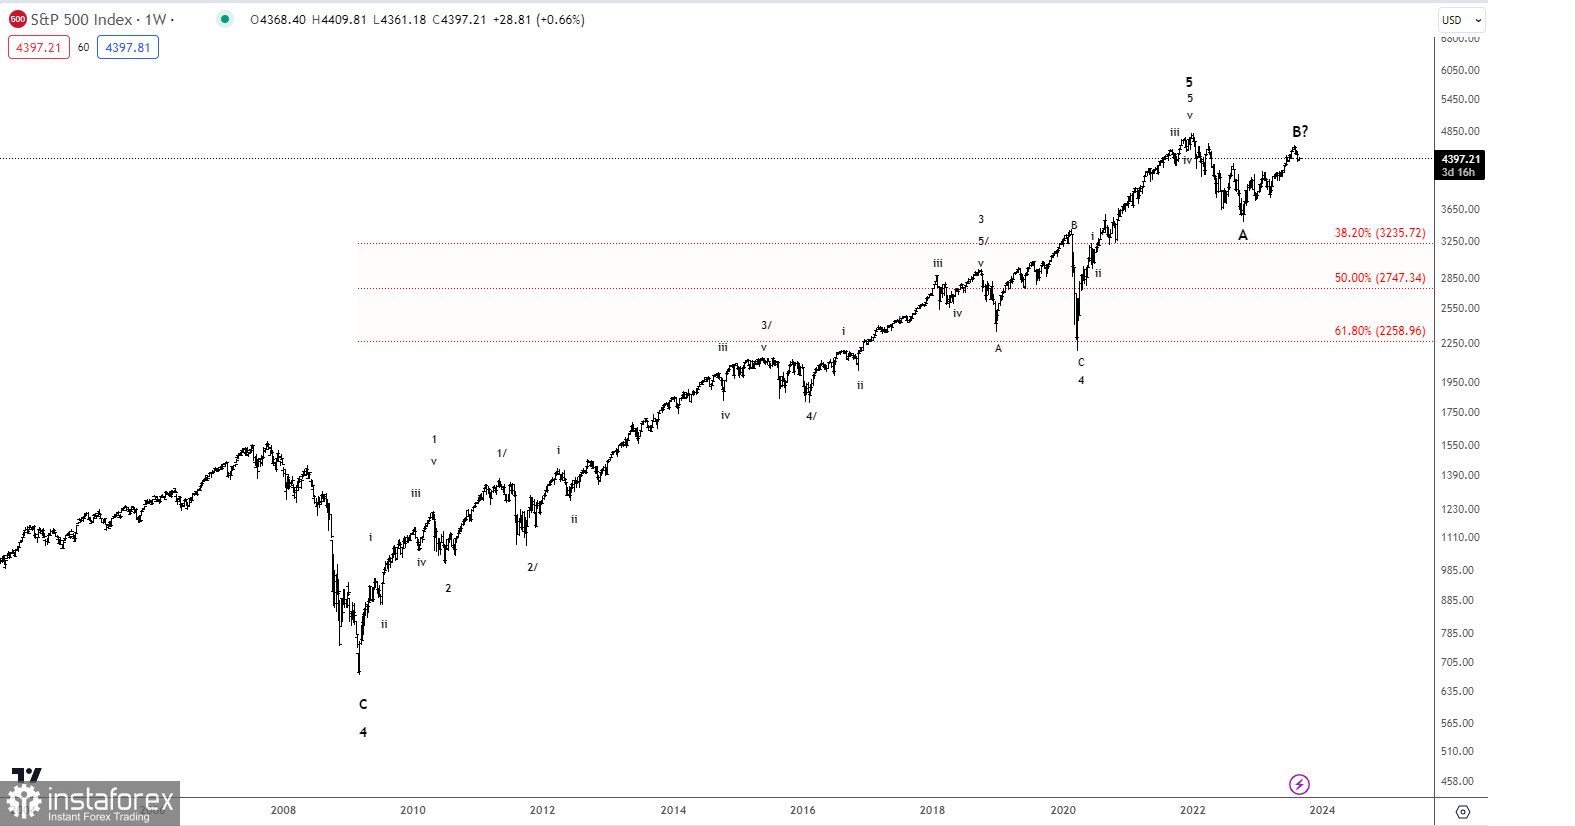
Our ideal count shows that the S&P 500 index peaked in the first week of January 2022 at 4,820. A larger corrective decline is now in motion. That said, we could still see a new all-time high if the corrective structure is an expanded flat correction. In that case, wave B will surpass the peak of wave A and move closer to 5,320 before turning lower in wave C.
Autumn is almost always a difficult period for equity markets and we don't see any reason why Autumn 2023 should be any different. Also, take into consideration that the interest rates in the US continue to move higher due to inflation pressure.
Short term, we would like to see a break below support near 4,150 as a strong indication that wave B has been completed and wave C lower has taken over for a decline towards at least 2,747 and likely even closer to 2,259.


