


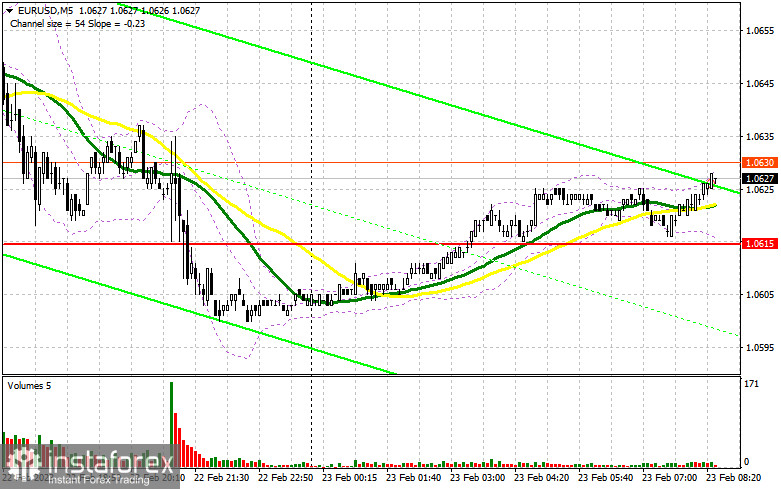
Yesterday was not a very interesting trading day. Traders did not receive any signal to enter the market. Let us take a look at the 5-minute chart to clear up the situation. Earlier, I asked you to pay attention to the level of 1.0666 to decide when to enter the market. The pair approached 1.0666 but it lacked just several pips to test it. As a result, a false breakout was not confirmed and traders did get a sell signal. In the second part of the day, the situation repeated.
Conditions for opening long positions in EUR/USD:
The protocol of the FOMC meeting in February was not interesting at all. None of the comments could have influenced traders' views on the future monetary policy. It is obvious that the Fed will continue raising the key rate and keep it high for a long period of time. Nevertheless, today, the euro may show a correction amid the data on the eurozone CPI. The indicator is expected to rise after a decline in the previous month. If the data exceeds the forecast, the pair may rise. Otherwise, pressure on the euro may return and buyers will have to protect the intermediate support level of 1.0615. Traders may go long only after a false breakout of this level with the target at the resistance level of 1.0655. Slightly below this level, there are bearish MAs. A breakout and a downward test of 1.0655 amid high inflation in the eurozone will give an additional buy signal with the target at 1.0695. However, the pair will hardly go above this level. A breakout of 1.0695 will become possible only after the publication of the US GDP data. This will affect bears' stop orders, thus forming one more buy signal with the target at 1.0732, where it is better to lock in profits. If the euro/dollar pair declines and buyers fail to protect 1.0615 in the first part of the day, pressure on the pair will return. A breakout of this level will intensify the bearish trend. In the event of this, traders will focus on the next support level of 1.0576, a new weekly low. Only a false breakout of this level will give a buy signal. Traders may also go long just after a bounce off the level of 1.0533 or even lower – at 1.0487, expecting a rise of 30-35 pips within the day.
Conditions for opening short positions on EUR/USD:
Traders could open short orders at 1.0655. If bears fail to protect this level, the downward trend will lose momentum. Notably, sellers became active near the closest support level of 1.0615. If the price returns to this level, investors will launch a massive sell-off. If the eurozone reports a rise in its inflation, the price may jump to 1.0655, where it will be possible to sell only after a false breakout and return to 1.0615. A breakout and a reverse test of this area will give an additional sell signal with the target at 1.0576, which will support bears. A settlement below this level will lead to a slump to 1.0533, where it is better to lock in profits. If the euro/dollar pair advances during the European session and bears fail to protect 1.0655, bulls will try to regain control over the market. In this case, traders should avoid selling the asset until the price touches 1.0695. There, they may enter the market only after an unsuccessful settlement. Traders may go short just after a rebound from the high of 1.0732, expecting a decline of 30-35 pips.
COT report
Since a technical problem in the CFTC has been settled yet. The latest COT report was published on January 24. Thus, the COT report for January 24 logged a rise in both short and long positions. Traders have significantly increased long positions following hawkish speeches of ECB policymakers. They are betting on further monetary tightening by the ECB and the Fed's dovish stance. The US regulator may reduce the pace of tightening for the second time in a row. Weak macro stats on the US economy, namely a drop in retail sales and a slowdown in inflation may force the central bank to take a pause in rate hikes to avoid any damage. This week, several central banks will hold their meetings. Their results will eventually determine the trajectory of the euro/dollar pair. According to the COT report, the number of long positions of the non-commercial group of traders increased by 9,464 to 237,743 while short positions advanced by 2,099 to 103,394. At the end of the week, the total non-commercial net position rose to 134,349 from 126,984. It appears investors believe in the upside potential of the euro. Nevertheless, they are waiting for more clues from central banks regarding interest rates. The weekly closing price grew to 1.0919 from 1.0833.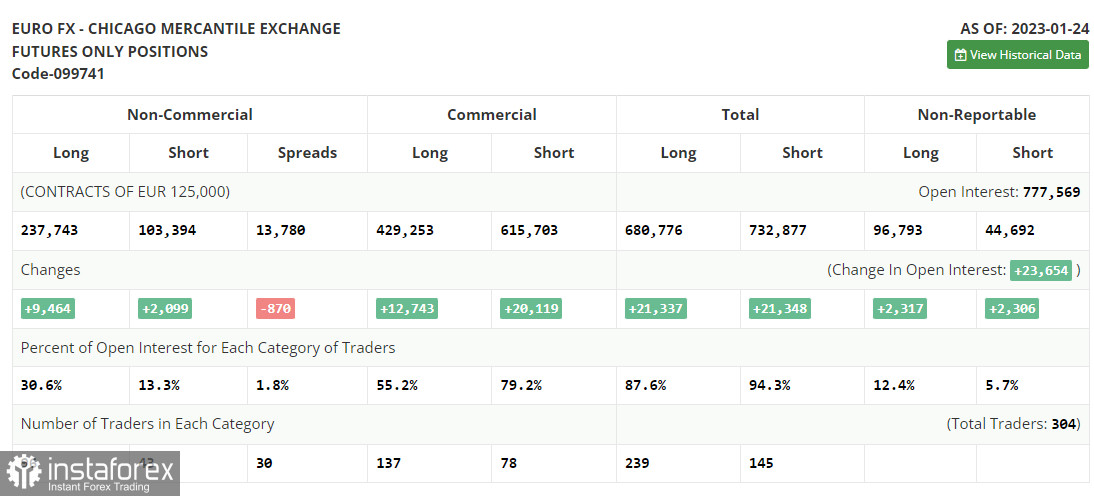
Signals of indicators:
Moving Averages
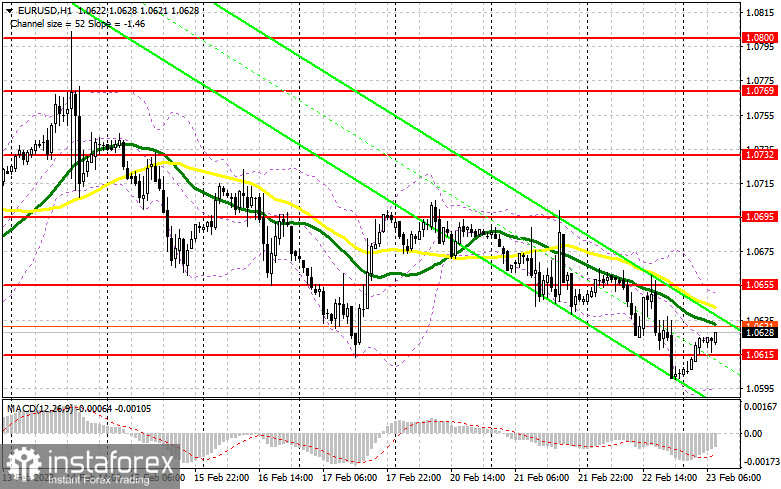
Trading is performed below the 30- and 50-day moving averages, which points to bearish sentiment.
Note: The author considers the period and prices of moving averages on the one-hour chart which differs from the general definition of the classic daily moving averages on the daily chart.
Bollinger Bands
If the pair increases, the resistance level will be formed by the upper limit of the indicator located at 1.0655. In case of a decline, the lower limit of the indicator located at 1.0580 will act as support.
Description of indicators
- Moving average (a moving average determines the current trend by smoothing volatility and noise). The period is 50. It is marked in yellow on the chart.
- Moving average (a moving average determines the current trend by smoothing volatility and noise). The period is 30. It is marked in green on the graph.
- MACD indicator (Moving Average Convergence/Divergence - convergence/divergence of moving averages). A fast EMA period is 12. A slow EMA period is 26. The SMA period is 9.
- Bollinger Bands. The period is 20.
- Non-profit speculative traders are individual traders, hedge funds, and large institutions that use the futures market for speculative purposes and meet certain requirements.
- Long non-commercial positions are the total number of long positions opened by non-commercial traders.
- Short non-commercial positions are the total number of short positions opened by non-commercial traders.
- The total non-commercial net position is a difference in the number of short and long positions opened by non-commercial traders.


