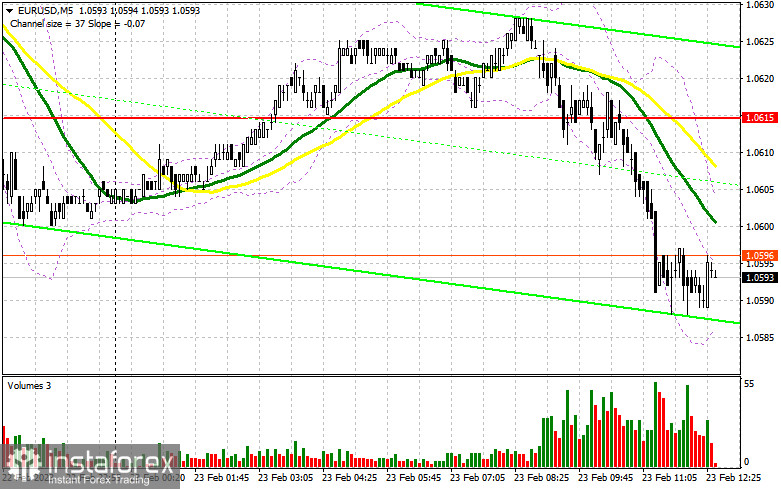
In my morning forecast, I focused on the level of 1.0615 and advised traders to base their market entry decisions on it. Let's take a look at the 5-minute chart and see what happened. This breakthrough occurred without a top-down reverse test, which prevented receiving a signal to enter the market. The technical picture changed in the afternoon.

To open long positions on EUR/USD, you will need the following:
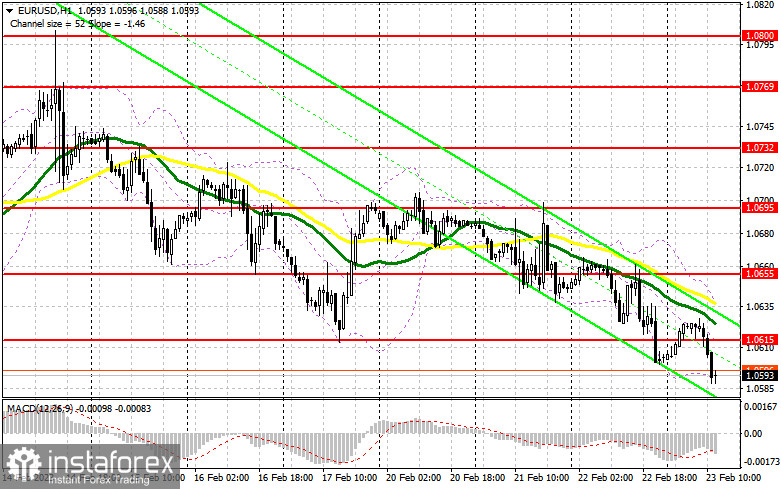
We anticipate data on US GDP as well as a labor market report, which may further undermine the position of European currency purchasers and contribute to a strengthening of the US dollar. If the pair remains under pressure, I will only take the euro in the range of the next low of 1.0576, which the bears are gradually approaching. When a false breakout occurs there, I purchase to return to the resistance of 1.0615 formed by yesterday's results. The breakout and top-down test of 1.0615 against the backdrop of weak GDP data and a weakening labor market in the United States provide a further entry point for accumulating long positions with a move to 1.0655. The collapse of 1.0655 will hit the bears' stop orders, causing the market to change and providing an extra signal with the probability of going to 1.0695, where I will fix profits. If the EUR/USD falls and there are no buyers at 1.0576 in the afternoon, the pair will remain under pressure, and a break of this level would further strengthen the bearish trend. In this situation, the focus will be on the following support level of 1.0533. Only the formation of a fake breakout will give a buy signal for the euro. I will immediately open long positions for a rebound from the low of 1.0487, or even lower, around 1.0451, with the target of a 30-35 point upward reversal within the day.
To open a short position on EUR/USD, you will need the following:
Sellers of the euro ignored eurozone inflation and the likelihood of more interest rate increases by the European Central Bank, pushing the euro lower and lower. The emergence of a false breakout in the resistance area of 1.0615, which worked as support in the morning, and the moving averages playing on the sellers' side being placed just above it, will be the optimal scenario for establishing short positions in the current conditions. In this situation, the sales target will be a new weekly low of 1.0576. The breakout and reverse test of this range provide an additional indication to begin short positions with an exit at 1.0533, reinforcing the market's bearish tendency. Fixing below this range will result in a larger drop to the 1.0487 area, where I will take profits. If the EUR/USD rises during the US session and there are no bears at 1.0615, which can only happen if the GDP data is revised downward, I recommend that you hold short positions until the level of 1.0655. You can also sell there following a failed consolidation. I will begin short positions immediately for a rebound from the high of 1.0695, with the target of a 30-35 point decline.

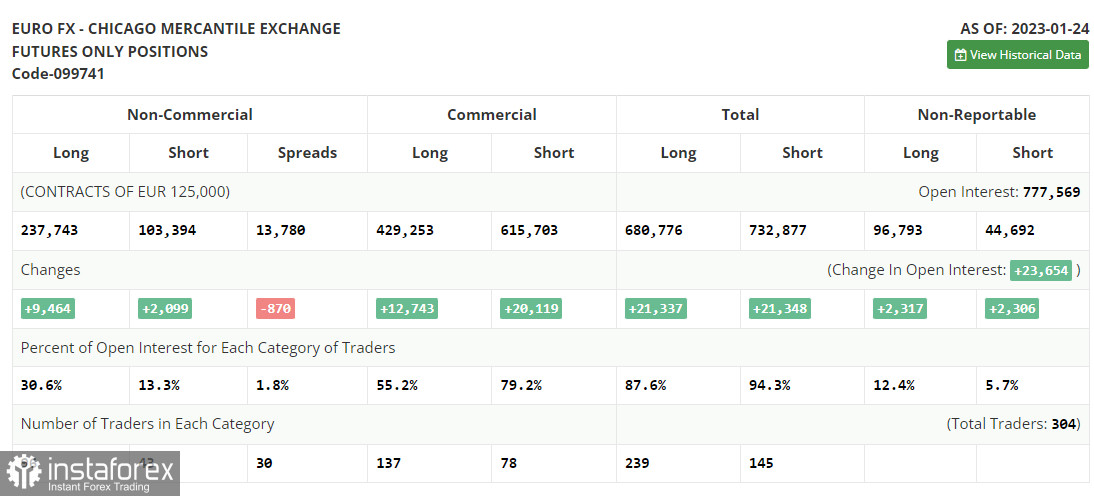
Due to a CFTC technical fault that has been ongoing for more than two weeks. The most recent COT reports have not yet been published. The data after that is only for January 24.
The January 24 COT report (Commitment of Traders) showed a rise in both long and short positions. It is clear that traders aggressively increased their long positions last week in response to the statements given by ECB officials. They did so in anticipation of the European regulator continuing its aggressive policy and the Federal Reserve System adopting a less aggressive stance, which might result in the rate hike being reduced for the second time in a row. Recent weak fundamental statistics on the US economy, particularly the decline in retail sales and the slowing of inflationary pressures, suggest that now is the time to slow down, as more tight Fed policy could undermine the economy. This week's central bank meetings will determine the pair's future direction. According to the COT data, long non-profit positions increased by 9,464 to 237,743, while short non-profit positions increased by 2,099 to 103,394. The total non-commercial net position increased to 134,349 from 126,984 after the week. All of this shows that investors believe in the euro's future growth but are waiting for the central bank to provide a clearer picture of interest rates. The weekly ending price increased to 1.0919 from 1.0833.

Signals from indicators:
Moving Averages
Trade is taking place below the 30- and 50-day moving averages, indicating a seller's advantage.
Note: The author considers the period and prices of moving averages on the hourly chart H1, which differ from the standard definition of classic daily moving averages on the daily chart D1.
Bands of Bollinger
In the event of the growth, the indicator's upper limit around 1.0640 will operate as resistance.
Description of indicators
- Moving average (moving average determines the current trend by smoothing out volatility and noise). Period 50. The graph is marked in yellow.
- Moving average (moving average determines the current trend by smoothing out volatility and noise). Period 30. The graph is marked in green.
- MACD indicator (Moving Average Convergence / Divergence - moving average convergence/divergence) Fast EMA period 12. Slow EMA period 26. SMA period 9
- Bollinger Bands (Bollinger Bands). Period 20
- Non-profit speculative traders, such as individual traders, hedge funds, and large institutions use the futures market for speculative purposes and to meet certain requirements.
- Long non-commercial positions represent the total long open position of non-commercial traders.
- Short non-commercial positions represent the total short open position of non-commercial traders.
- Total non-commercial net position is the difference between the short and long positions of non-commercial traders.


