


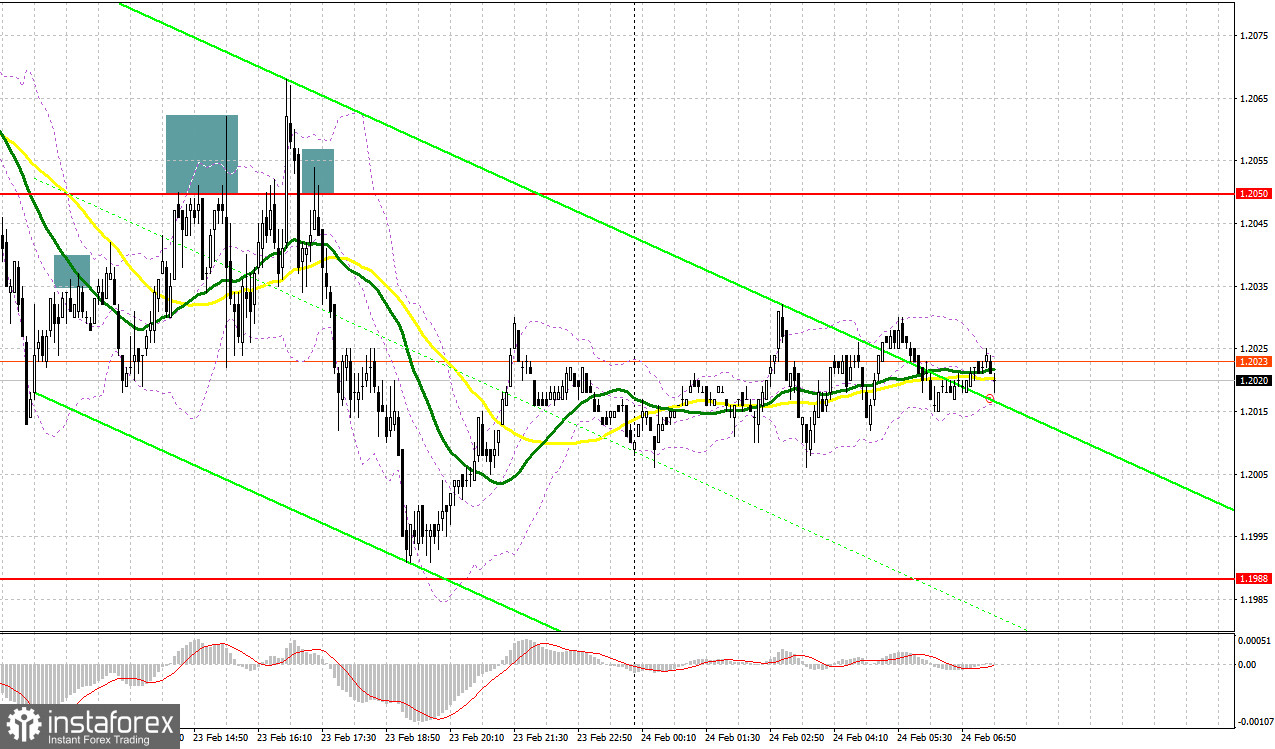
Yesterday, the pair formed several signals to enter the market. Let's have a look at the 5-minute chart and see what happened there. In my morning review, I mentioned the level of 1.2037 as a possible entry point. The price quickly dropped to this level and broke through it. Then, a retest of this level generated a sell signal but the pair declined by just 15 pips. Later, the pound recovered again. In the second half of the day, a failed attempt to hold above 1.2050 created more selling opportunities and resulted in a decline of 50 pips.
For long positions on GBP/USD:
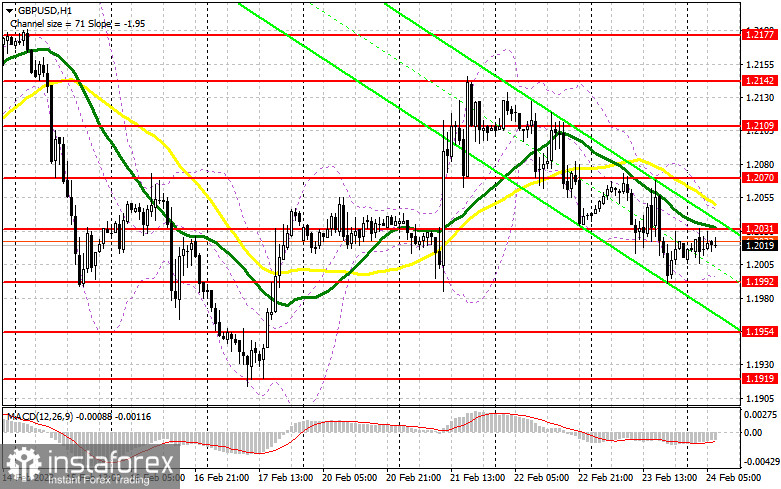
On Friday, there are no major events in the UK economic calendar except for the speech by BoE MPC Silvana Tenreyro. So, the pound will have a chance to develop an upside correction at the end of the week and secure its position at the key support of 1.1992 which allows the pair to stay within the sideways channel. If the pair comes under pressure in the first half of the day, bulls will have to do their best to protect the level of 1.1992. A drop to this level and its false breakout will give a buy signal and a possibility to test the area of 1.2031. Just above this range, moving averages support the bears. If the price settles at this range and tests it downwards, I will bet on the extended correction on GBP/USD and its possible rise to the high of 1.2070 which serves as an upper boundary of the sideways channel. A break above this range will pave the way to the next target at 1.2109 where I'm going to take profit. If bulls fail to open positions at 1.1992 in the first half of the session, which cannot be ruled out, bears will assert their strength more aggressively, and the pressure on GBP/USD will increase. If so, I would recommend opening long positions only at the next support of 1.1954 and only after a false breakout. I will buy GBP/USD right after a rebound from the monthly low of 1.1919, bearing in mind an intraday correction of 30-35 pips.
For short positions on GBP/USD:
Bears managed to test all their targets yesterday and are now ready to retest the support of 1.1992. It would be reasonable to sell the pair only when bears show more activity at the new resistance of 1.2031 formed yesterday and above which moving averages are located. In case of vague comments by the BoE officials, bears will need to take action to protect this level. A false breakout amid a lack of fundamental events may form good entry points into short positions and send GBP/USD down to the strong support of 1.1992 where bulls were actively fighting for the pair yesterday. A breakout and a retest of this range will cancel the plans of the bulls to develop a further upside correction. So, bears will increase their presence in the market, generating sell signals and pushing the price down to 1.1954. The level of 1.1919 will act as the lowest target where I'm planning to take profit. If GBP/USD rises and bears are idle at 1.2031, bulls will continue to enter the market. In this case, bears will retreat until a false breakout at the next resistance of 1.2070 will create an entry point into short positions. If nothing happens there as well, I will sell GBP/USD from the high of 1.2109, considering a pullback of 30-35 pips within the day.
COT report:
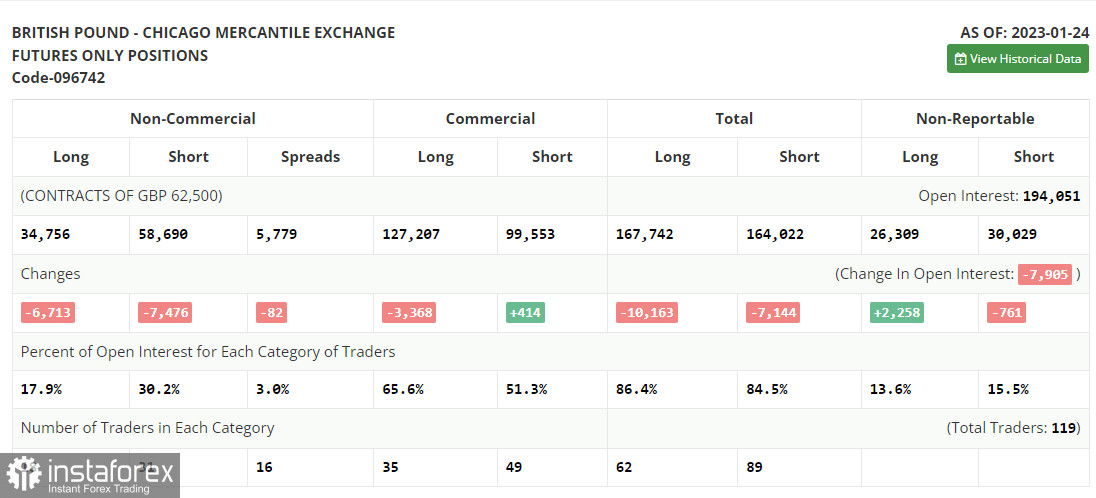
Due to a technical failure of the CFTC that has been going on for more than two weeks, new COT reports continue to be delayed. The most recent data was published on January 24.
The Commitments of Traders report for January 24 recorded a sharp drop in both long and short positions. However, this decline was within an acceptable range, given the situation the UK government is currently dealing with. The UK authorities are facing strikes and demand for higher wages while trying to bring inflation lower. According to the latest COT report, short positions of the non-commercial group of traders decreased by 7,476 to 58,690 while long positions dropped by 6,713 to 34,756. As a result, the negative value of the non-commercial net position declined to -23,934 from -24,697 recorded a week ago. Such moderate changes do not change the market balance. So, we should continue monitoring the economic situation in the UK and the decisions of the BoE. The weekly closing price went up to 1.2350 from 1.2290.
Indicator signals:
Moving Averages
Trading below the 30- and 50-day moving averages indicates that bears attempt to return to the market.
Please note that the time period and levels of the moving averages are analyzed only for the H1 chart, which differs from the general definition of the classic daily moving averages on the D1 chart.
Bollinger Bands
If the pair advances, the upper band of the indicator at 1.2050 will serve as resistance. In case of a decline, the lower band of the indicator at 1.1992 will act as support.
Description of indicators:
• A moving average of a 50-day period determines the current trend by smoothing volatility and noise; marked in yellow on the chart;
• A moving average of a 30-day period determines the current trend by smoothing volatility and noise; marked in green on the chart;
• MACD Indicator (Moving Average Convergence/Divergence) Fast EMA with a 12-day period; Slow EMA with a 26-day period. SMA with a 9-day period;
• Bollinger Bands: 20-day period;
• Non-commercial traders are speculators such as individual traders, hedge funds, and large institutions who use the futures market for speculative purposes and meet certain requirements;
• Long non-commercial positions represent the total number of long positions opened by non-commercial traders;
• Short non-commercial positions represent the total number of short positions opened by non-commercial traders;
• The non-commercial net position is the difference between short and long positions of non-commercial traders.


