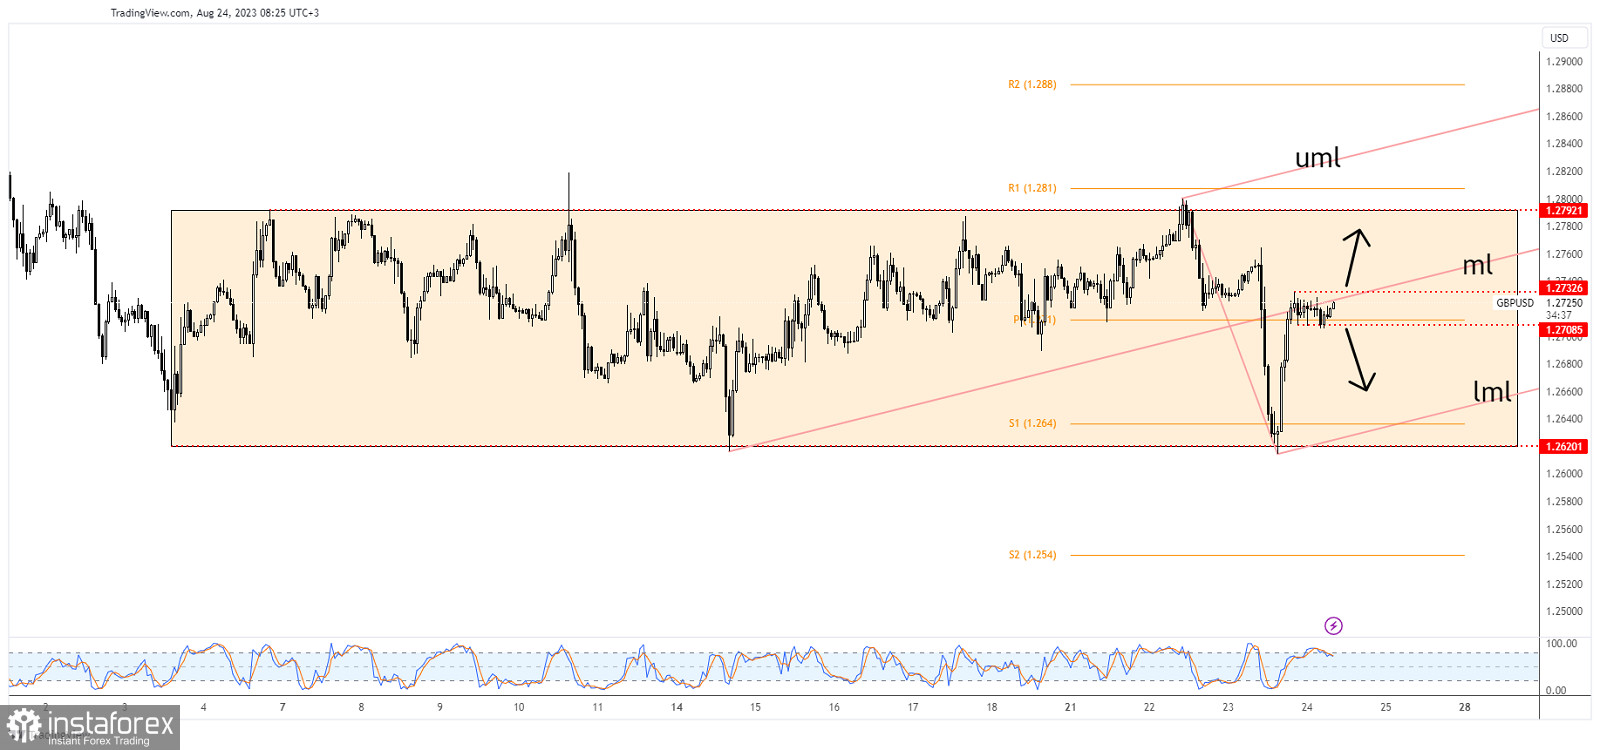
The GBP/USD pair turned to the upside in the short term as the Dollar Index crashed yesterday after the US data release. Now, it stands right below important resistance levels, so further growth is far from being confirmed. It's located at 1.2723 at the time of writing far above yesterday's low of 1.2614.
Yesterday, the currency pair crashed after the UK Flash Manufacturing PMI and Flash Services PMI confirmed contraction in both sectors. Later, the currency pair rallied after the US Flash Manufacturing PMI and Flash Services PMI reported poor data.
Today, the US data could move the rate in the short term. The Unemployment Claims indicator is expected to remain at 239K, Durable Goods Orders may report a 4.1% drop, while Core Durable Goods Orders are expected to register a 0.2% growth. The greenback could take the lead again only if the US reports positive data. Still, don't forget that Jackson Hole Symposium remarks or speeches could change the sentiment.
GBP/USD Buyers In Control!

The GBP/USD pair found support at 1.2620 and now it has turned to the upside. It's trapped between 1.2620 and 1.2792 levels. The false breakdown with great separation below 1.2620 announced a potential rally towards 1.2792.
Now, it has jumped above the weekly pivot point of 1.2710 and it is challenging the median line (ml) which represents a dynamic resistance.
GBP/USD Forecast!
A bullish closure above the median line (ml) and above 1.2732 is seen as a buying signal.
Staying below the median line (ml) and dropping below 1.2708 is seen as a selling signal.


