Details of the economic calendar on February 27
The U.S. Department of Commerce reported a 4.5% decline in orders for durable goods in January compared to the previous month. The decline was forecasted to be 4.0%. Last month's orders rose 5.1%, according to the revised data. Negative statistics put pressure on the dollar, which led to a local sell-off in the market.
Analysis of trading charts from February 27
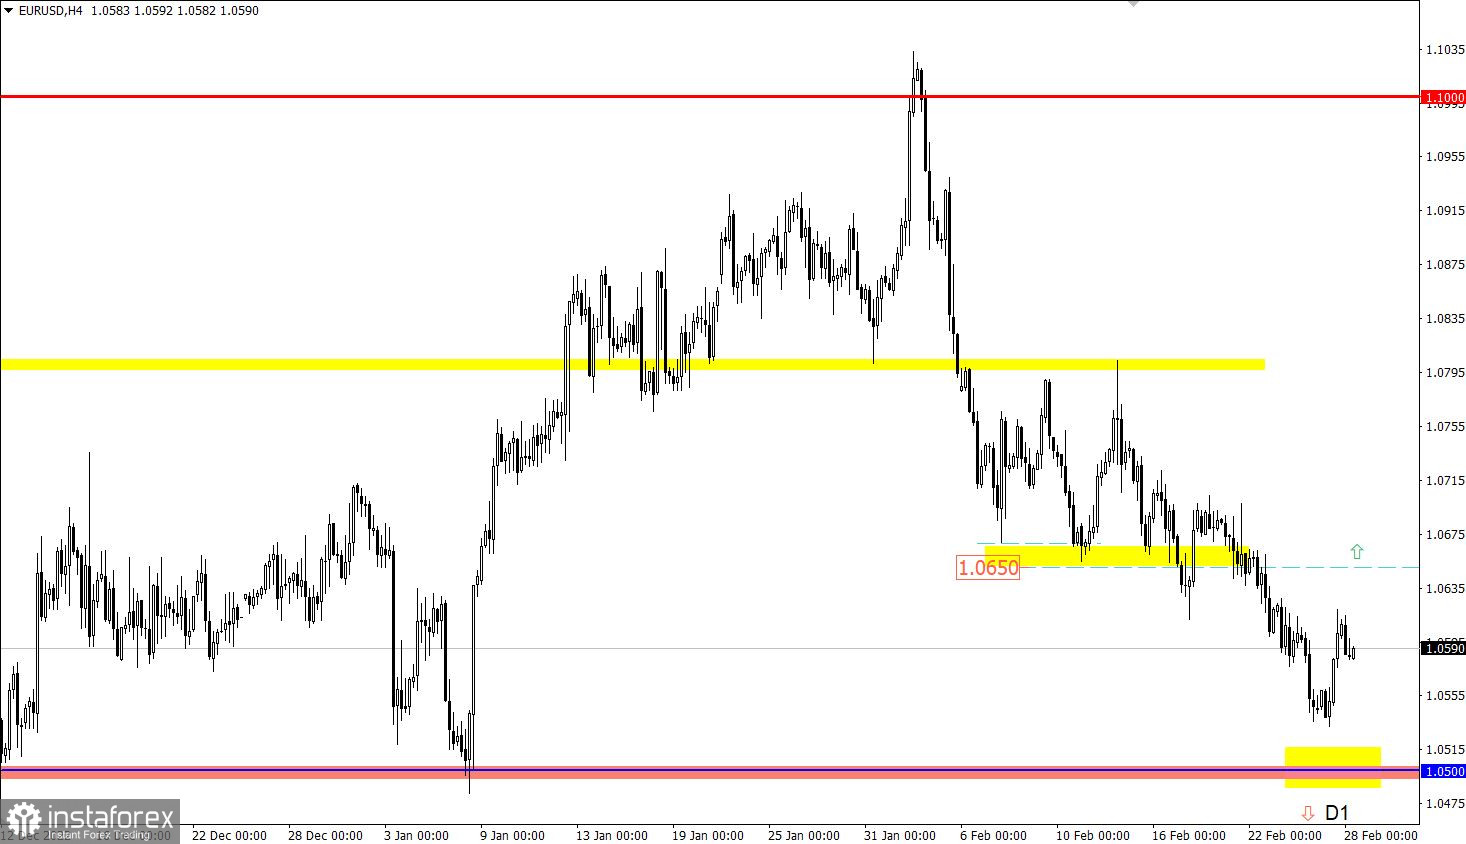
EUR/USD almost reached the 1.0500 support level, after which there was a reduction in the volume of short positions and a price pullback of about 80 pips. Note that since early February, the euro has been under sellers' pressure, which caused its decline by about 4%.
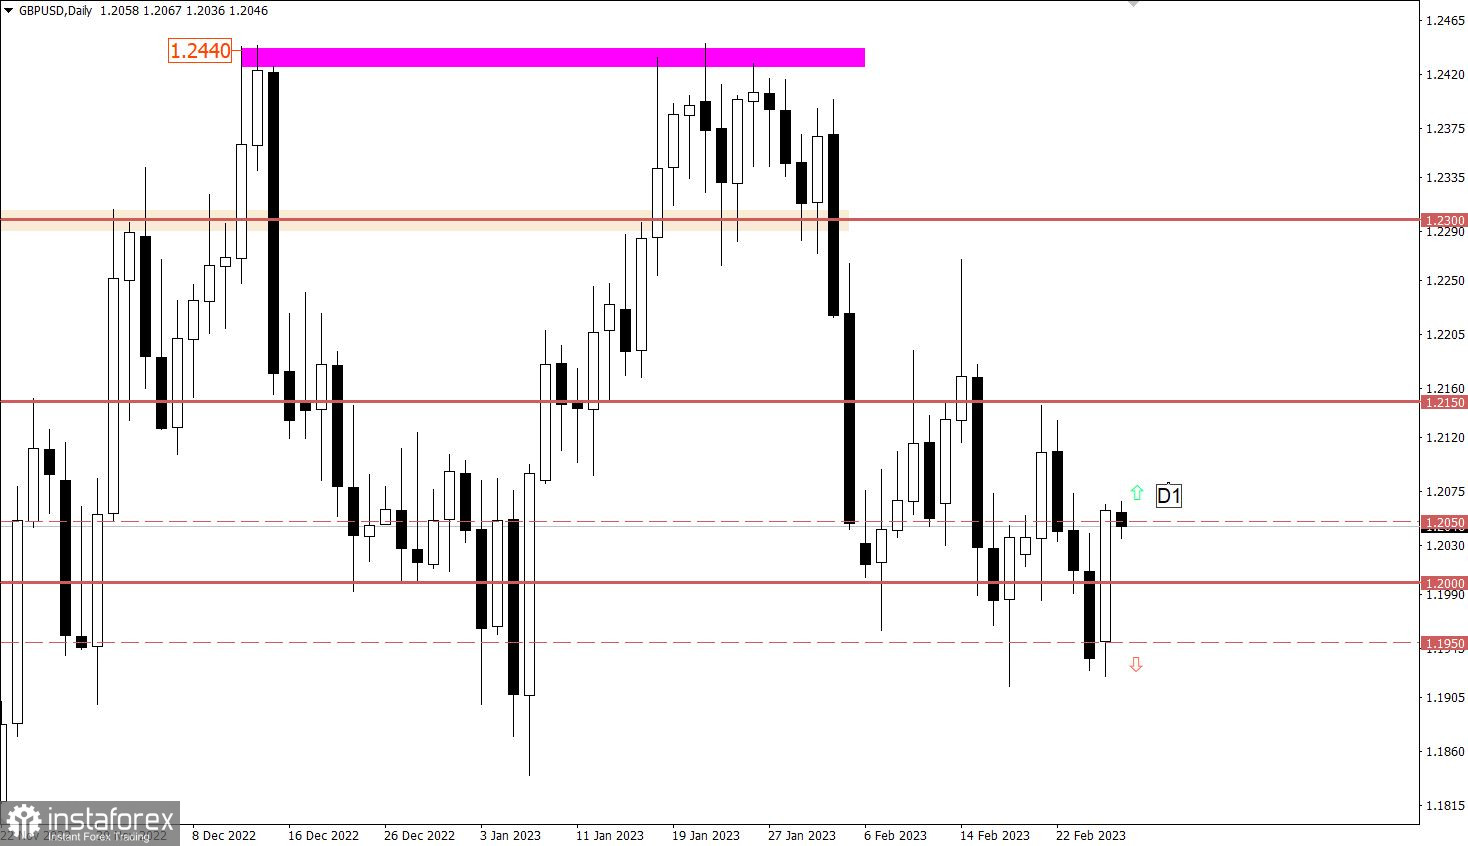
GBP/USD showed an upward trend, which led to the strengthening of its value by about 1%. Despite a noticeable change in price, the quote is still within the psychological level, so there are no significant changes in the trading chart.

Economic calendar for February 28
The macroeconomic calendar is almost empty. The only thing to look out for is the S&P/CS Composite-20 Housing Price Index in the United States. The index is estimated to decline, which is considered negative for the economy.
Time targeting:
U.S. S&P/CS Composite-20 HPI – 14:00 UTC
EUR/USD trading plan for February 28
If the pullback continues and the quote manages to stay above the 1.0650 level, this may lead to a change in trading interests and the subsequent recovery of the euro against the decline in February. However, in the event of a further fall in the exchange rate, with a possible update of the local low, there will probably be a breakdown of the 1.0500 support level.

GBP/USD trading plan for February 28
We observe fluctuations in the price range of 1.1950/1.2050, at which market participants interact with the 1.2000 psychological level. Most likely, the range of the reference level will remain in the market in the near future. However, if the price remains outside this range throughout the day, it may indicate further movement of the quote in one of the directions.

What's on the charts
The candlestick chart type is white and black graphic rectangles with lines above and below. With a detailed analysis of each individual candle, you can see its characteristics relative to a particular time frame: opening price, closing price, intraday high and low.
Horizontal levels are price coordinates, relative to which a price may stop or reverse its trajectory. In the market, these levels are called support and resistance.
Circles and rectangles are highlighted examples where the price reversed in history. This color highlighting indicates horizontal lines that may put pressure on the asset's price in the future.
The up/down arrows are landmarks of the possible price direction in the future.


