


Analysis of the EUR/USD 5M.
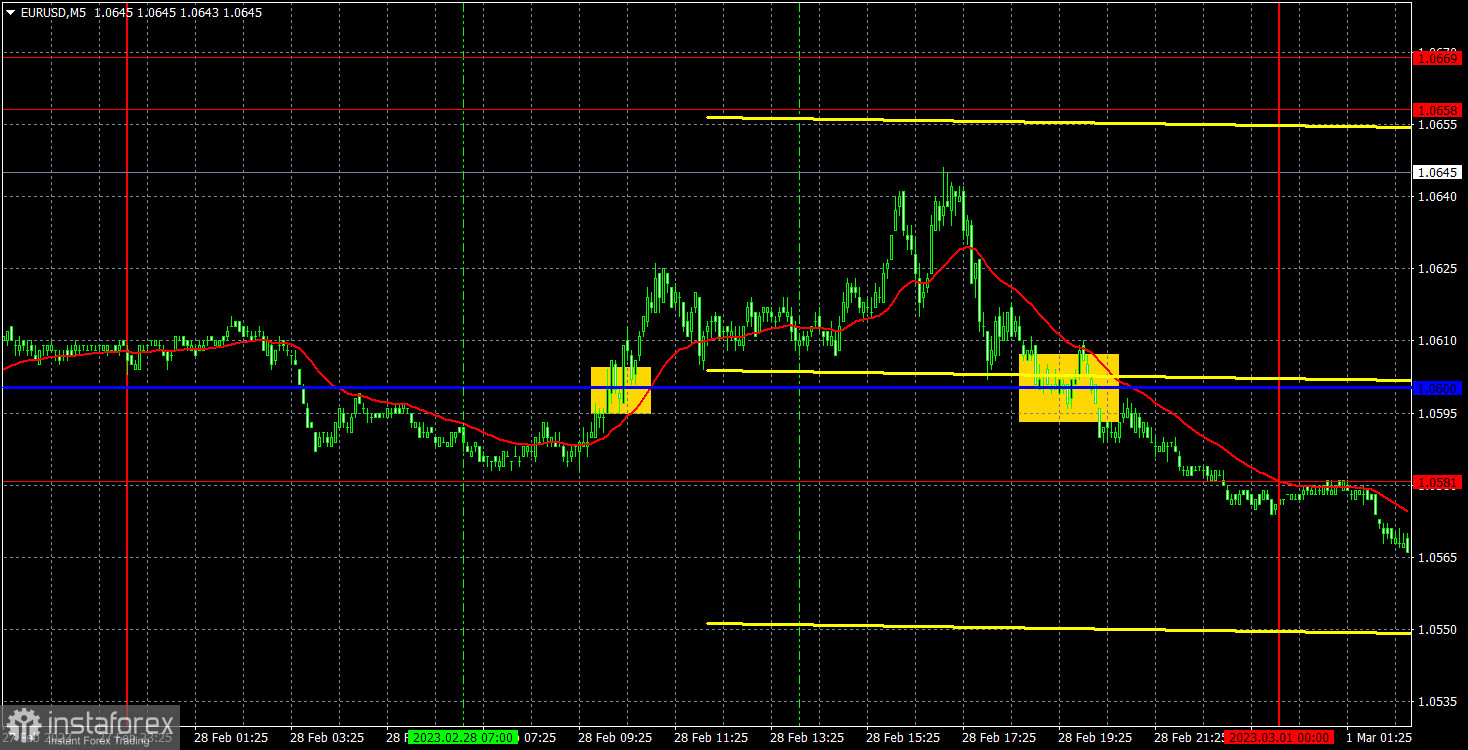
During the second trading day of the week, the EUR/USD currency pair experienced a variety of price movements. We saw a rapid increase at first, followed by a sharp decrease. On Tuesday, the pair's volatility was generally around 80 points, which is an average indicator. It is not surprising that the signals were not the best, as there was no clear direction of travel throughout the day. The macroeconomic and basic backgrounds were utterly absent at the same time. Hence, during the day, dealers had nothing to respond to. The movements were therefore strictly technical. It is impossible to say with certainty whether there was any response to the recent speeches by the ECB and Fed representatives. As a result, the price has fixed above the downward trend line on the hourly chart, changing the current trend to an upward one. We do not anticipate a significant increase in the value of the euro because we are anticipating a further decline. Nevertheless, there are still not many reasons for this. However, the "technique" allows the pair to move for a time.
Tuesday's trading signals were adequate for the nature of the pair's movement; they weren't the best, but they weren't the worst either. The price first cleared the pivotal Kijun-sen line, and then it increased by 35 points but fell short of the desired level of 1.0658. As a result, it is unlikely that traders will profit from a long position. The deal most likely closed with a stop-loss at breakeven. The sell signal shouldn't have been worked out because it was established late in the evening. As a result, there was no profit at day's end
The COT Report
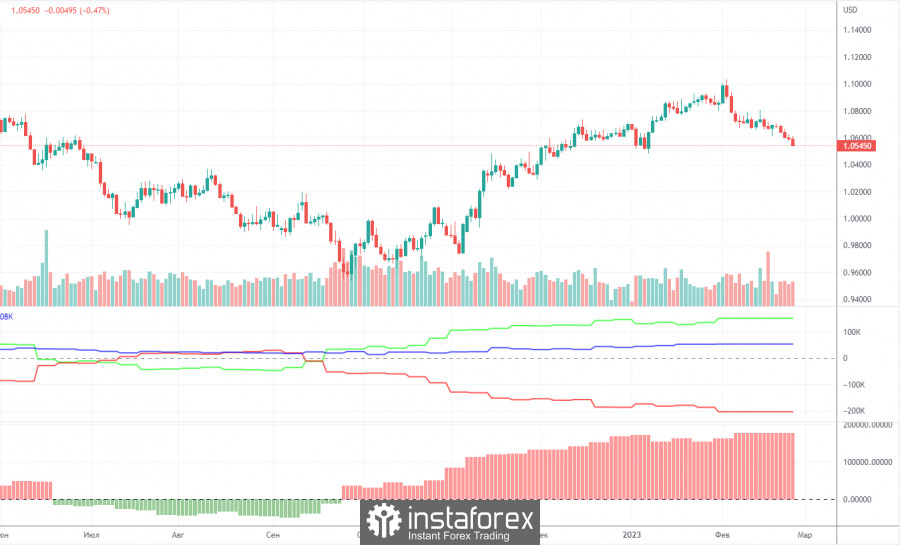
Technical difficulties prevented the release of COT reports for over a month, but on Friday, one of the delayed reports for January 31 was made available. This report doesn't make sense because a month has gone since it was written and we still don't have access to the data from the subsequent reports, which are more or less relevant. As a result, we keep looking at the available data. The graphic accurately reflected market conditions for the euro currency during the past few months. The aforementioned image makes it very evident that from the start of September, the net position of significant players (the second indicator) has been improving. At about the same time, the value of the euro started to increase. Although the net position of non-commercial traders is currently "bullish" and growing virtually weekly, it is the relatively high value of the "net position" that now signals the upward trend's impending end. This is indicated by the first indicator, which frequently occurs before the end of a trend and on which the red and green lines are quite far apart. The euro has already started to decline, although it's unclear if this is just a brief pullback or the start of a new downtrend. The number of buy-contracts from the non-commercial group increased by 9.0 thousand during the most recent reporting week, while the number of short positions declined by 7.1 thousand. The net position thus increased by 16.1 thousand contracts. Currently, there are 148 thousand more buy contracts than sell contracts for non-commercial traders. Nonetheless, the correction has been developing for a while, so it is obvious even without news that the pair should keep falling.
Analysis of the EUR/USD 1H.
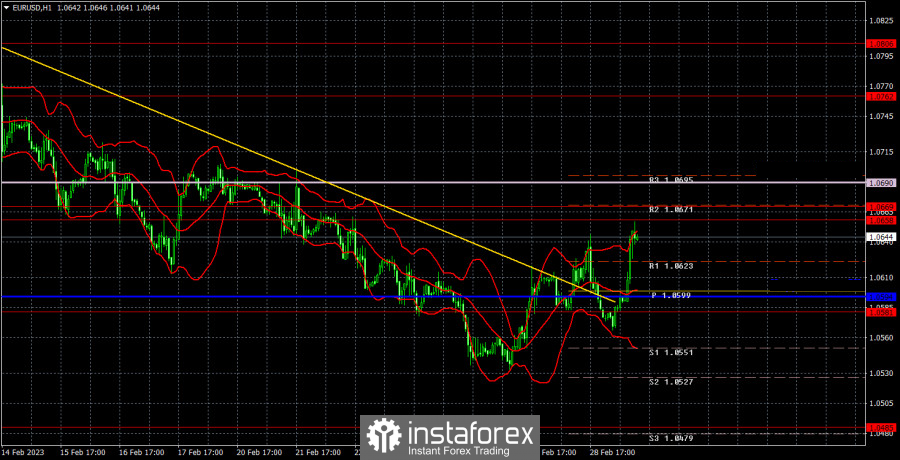
The pair is currently shifting the trend to an upward one on an hourly timeframe. Remember that if the price fixes above the critical line and the trend line, the trend cannot be regarded as totally canceled if the price is below the Senkou Span B line. As a result, the price can freely approach Senkou Span B; however, whether it crosses this line will determine the price's future direction. The following levels are designated for trading on Wednesday: 1.0340-1.0366, 1.0485, 1.0581, 1.0658-1.0669, 1.0762, 1.0806, as well as the Senkou Span B (1.0690) and Kijun-sen (1.0594) lines. The Ichimoku indicator's lines might move during the day, therefore this should be considered while choosing trade signals. Other support and resistance levels exist as well, but no signals are created close to them. Levels, extremes, and lines can be "bounced" and "overcome" by signals. Remember to place a stop-loss order at breakeven if the price moves up or down by 15 points. If the signal turns out to be false, this will protect against possible losses. The United States ISM manufacturing index and Germany's somewhat significant inflation report will both be released on March 1. We think there might be a response to both reports. Traders have probably been preparing the German inflation report "in advance" since the morning.
Explanations for the illustrations:
Thick red lines represent price levels of support and resistance (resistance/support), where the movement may come to an end. They don't provide trading signals, though.
The Ichimoku indicator's Kijun-sen and Senkou Span B lines have been moved from the 4-hour timeframe to the hourly one.
The price previously bounced off of the thin red lines that represent extreme levels. They provide signals for trading.
Yellow lines are trend lines, trend channels, and any other technical patterns.
The net position size of each trading category is represented by indicator 1 on the COT charts.
The net position size for the "Non-commercial" category is shown by indicator 2 on the COT charts.


