To open long positions on the GBP/USD, you must:
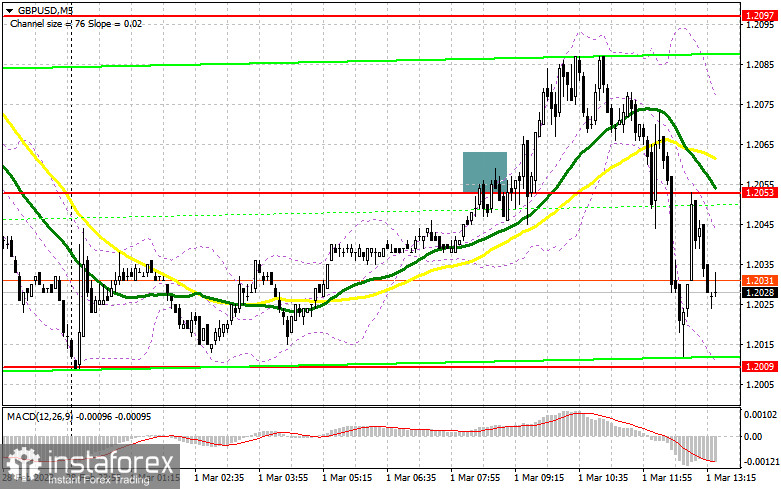
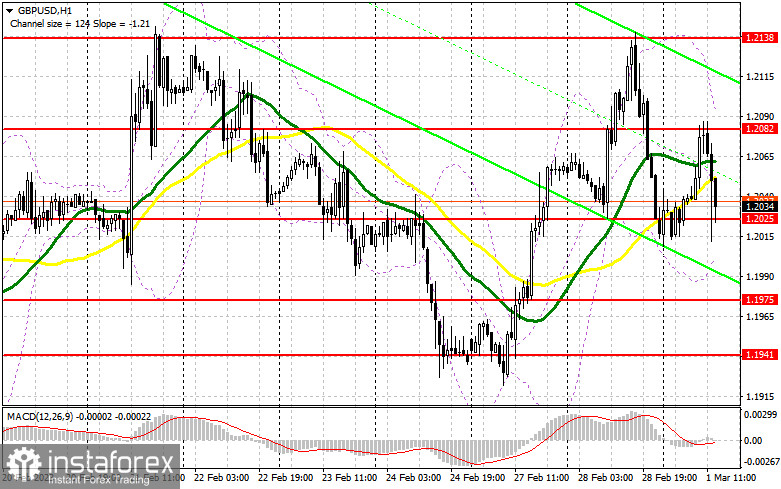
Manufacturing activity in the UK gave traders a strong incentive to sell the pound in the morning because it was still below 50 points. The focus is currently on similar statistics for the United States. Everyone is going to be curious to see how the ISM manufacturing index performed in February of this year and how much activity declined. A further decrease in the pound in the area of 1.2025 should unquestionably be met with purchases; else, the trend might quickly shift the other way. If the data is better than expected, the drop and the afternoon development of a false breakout in the area of 1.2025 will provide you with a great entry opportunity to purchase with the possibility of a breakthrough to 1.2082—a new resistance set during the European session. I will only wager on the continuation of the movement of the GBP/USD up to the maximum of 1.2138 when setting and testing this range from top to bottom against the backdrop of negative US data. Although it is unlikely that an exit would occur above this area today, it will open up growth prospects around 1.2177, where I have set profits. The emergence of a new bullish trend will be signaled by a test of this area. The market will return to equilibrium if the bulls are unable to complete the tasks at hand and miss 1.2025, which is also expected after the address by Federal Reserve System members. In this situation, I urge you to wait before making any purchases and to only start long positions near the 1.1975 support and only in the event of a false drop. I'll buy GBP/USD right away only if it rises over the monthly low of 1.1941 with the intention of a correction of 30-35 points during the day.
For opening short positions on the GBP/USD, you will need:
The sellers did not complete the tasks assigned for the first half of the day; rather, they completed them, but not exactly how I had anticipated. With a new upward movement of the pair in the afternoon, short positions will be considered only after the development of a false breakout in the 1.2082 level, which will signal an entry into the market with the likelihood of a decline in the area of new support at 1.2025, which was tested today during the European session. Buyers' hopes for a further correction will be dashed by a repeated exit to 1.2025 with a breakout and a bottom-up test, turning the market bearish with a sell signal and a decline to 1.1975. The area around 1.1941 will be my furthest target, and that's where I'll set the profit. Given the possibility of more GBP/USD increases and the absence of bears at 1.2082, the bulls will continue to actively enter the market. In this scenario, the bears will pull back once more, and an entry point for short positions will only be formed by a false collapse around the next resistance level of 1.2138. In the absence of activity, I will sell GBP/USD at the maximum of 1.2177, but only if the pair falls by 30-35 points within the day.

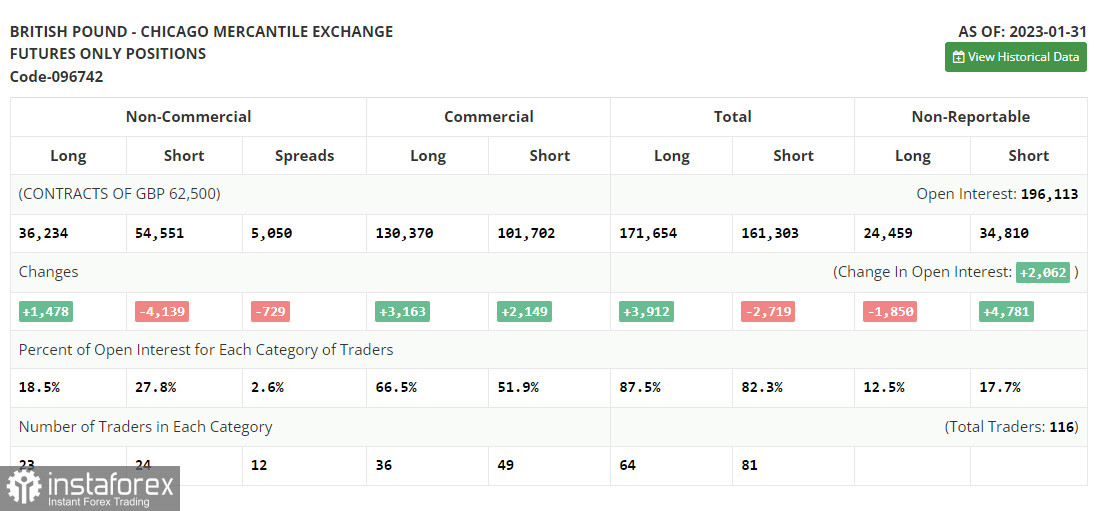
There were more long positions and fewer short ones in the COT report (Commitment of Traders) for January 31. Traders preferred to leave the market before the meeting because they were betting on a subsequent increase in interest rates from the Bank of England. However, it should be noted that these data are of no importance right now because statistics are only just starting to catch up following the cyberattack on the CFTC and the information from a month ago is not very pertinent right now. They will wait for new reports to be released before relying on more recent statistics. Except for a few reports, there are no significant fundamental indicators for the US economy this week, so the pressure on risky assets may lessen slightly. In principle, this may increase the pound's value relative to the US dollar. According to the most recent COT data, short non-commercial holdings fell by 4,139 to 54,551, while long non-commercial positions rose by 1,478 to 36,234. As a result, the non-commercial net position's negative value declined to -18,317 from -23,934 a week earlier. In comparison to 1.2350, the weekly ending price dropped to 1.2333.

Signals from indicators
Moving Averages
Trade occurs in the area of the 30 and 50-day moving averages, which suggests market uncertainty.
On the hourly chart H1, the author takes into account the time and prices of moving averages, which are different from the standard definition of the traditional daily moving averages on the daily chart D1.
Bands by Bollinger
The indicator's upper limit in the area of 1.2090 will serve as resistance in the event of an increase.
Description of indicators
- Moving average (moving average determines the current trend by smoothing out volatility and noise). Period 50. The graph is marked in yellow.
- Moving average (moving average determines the current trend by smoothing out volatility and noise). Period 30. The graph is marked in green.
- MACD indicator (Moving Average Convergence / Divergence - moving average convergence/divergence) Fast EMA period 12. Slow EMA period 26. SMA period 9
- Bollinger Bands (Bollinger Bands). Period 20
- Non-profit speculative traders, such as individual traders, hedge funds, and large institutions, use the futures market for speculative purposes and to meet certain requirements.
- Long non-commercial positions represent the total long open position of non-commercial traders.
- Short non-commercial positions represent the total short open position of non-commercial traders.
- Total non-commercial net position is the difference between the short and long positions of non-commercial traders.


