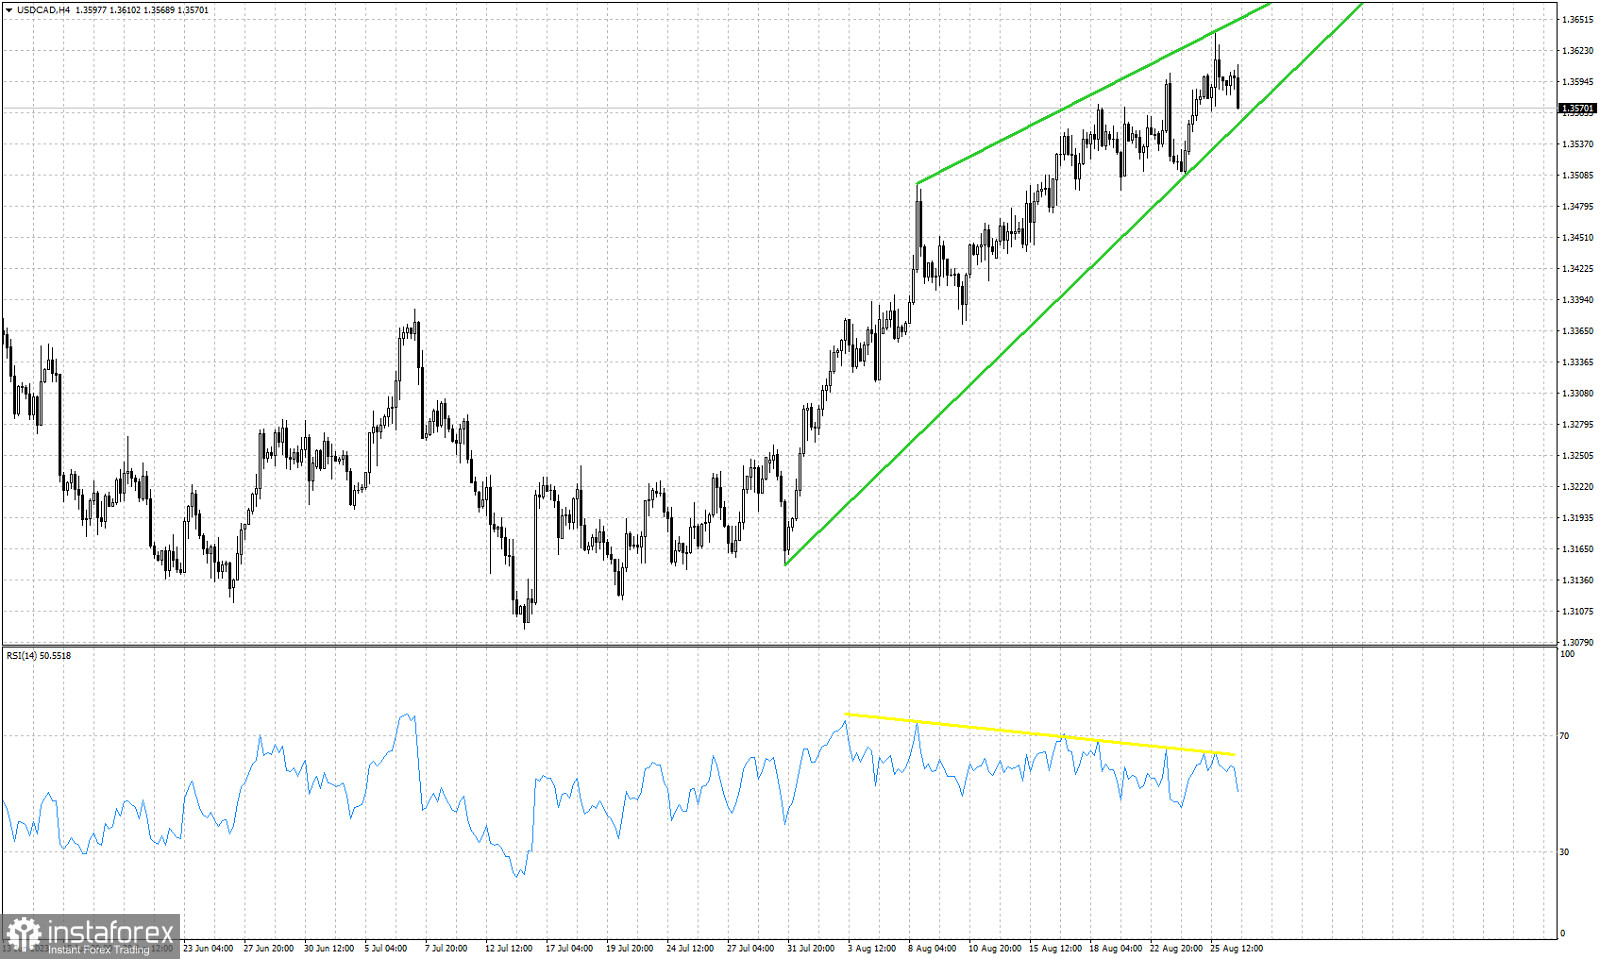
Green lines- wedge pattern
Yellow line- bearish RSI divergence
USDCAD is trading around 1.3574 after making a new higher high last week around 1.3638. As we mentioned in our previous posts, we continue to believe that the upside potential is limited. Price technically remains in a bullish trend, but the RSI is not making higher highs. Instead the RSI is providing bearish divergence signals. The bearish divergence signals are not bearish reversal signs. They are warnings of a weakening up trend. Support is found at 1.3555 and at 1.3508. The week has started with price under pressure and bulls need to be cautious. There are increased chances that price breaks out and below the wedge pattern. This would be a bearish signal. As last week, we remain neutral if not bearish USDCAD.


