Ethereum, the second-largest cryptocurrency by market capitalisation, has been trading in a downward trend against the US dollar since reaching a historical high of 4868 $ on May 2021.
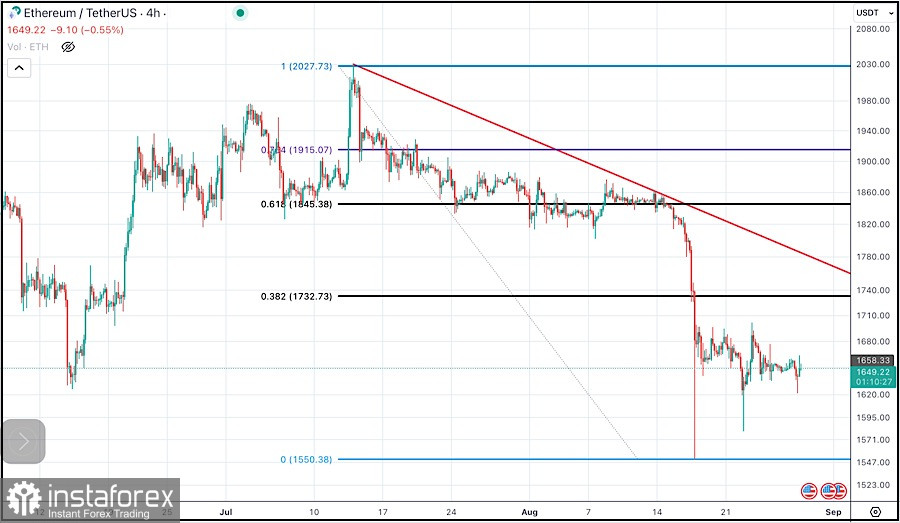
The ETH/USDT pair has formed lower highs and lower lows on the H4 chart, indicating a bearish momentum. The pair has also broken below several key support levels, such as 1800 and 1700 dollars.
Hence, the pair is still facing strong resistance from the descending trendline that connects the lower highs on the depicted chart.
Therefore, based on the technical analysis of the H4 chart, the outlook for the pair remains bearish in the short term.
Ethereum prices may continue to decline to test the support level around 1600.
A break below this level could open the door for further declines towards 1500 and 1300 levels.
On the other hand, a break above the descending trendline could signal a reversal of the downtrend and a potential rally towards 2000 and 2200.


