


Bitcoin is trading in the red at 25,950 at the time of writing. The downside pressure remains high, so more declines are possible. You knew from my previous analyses that the bias is bearish despite temporary rebounds.
In the last 24 hours, BTC/USD is up by 0.06% but it's down by 0.24% in the last 7 days. In the short term, it could extend its sideways movement, that's why we have to wait for a fresh trading opportunity.
BTC/USD Range!
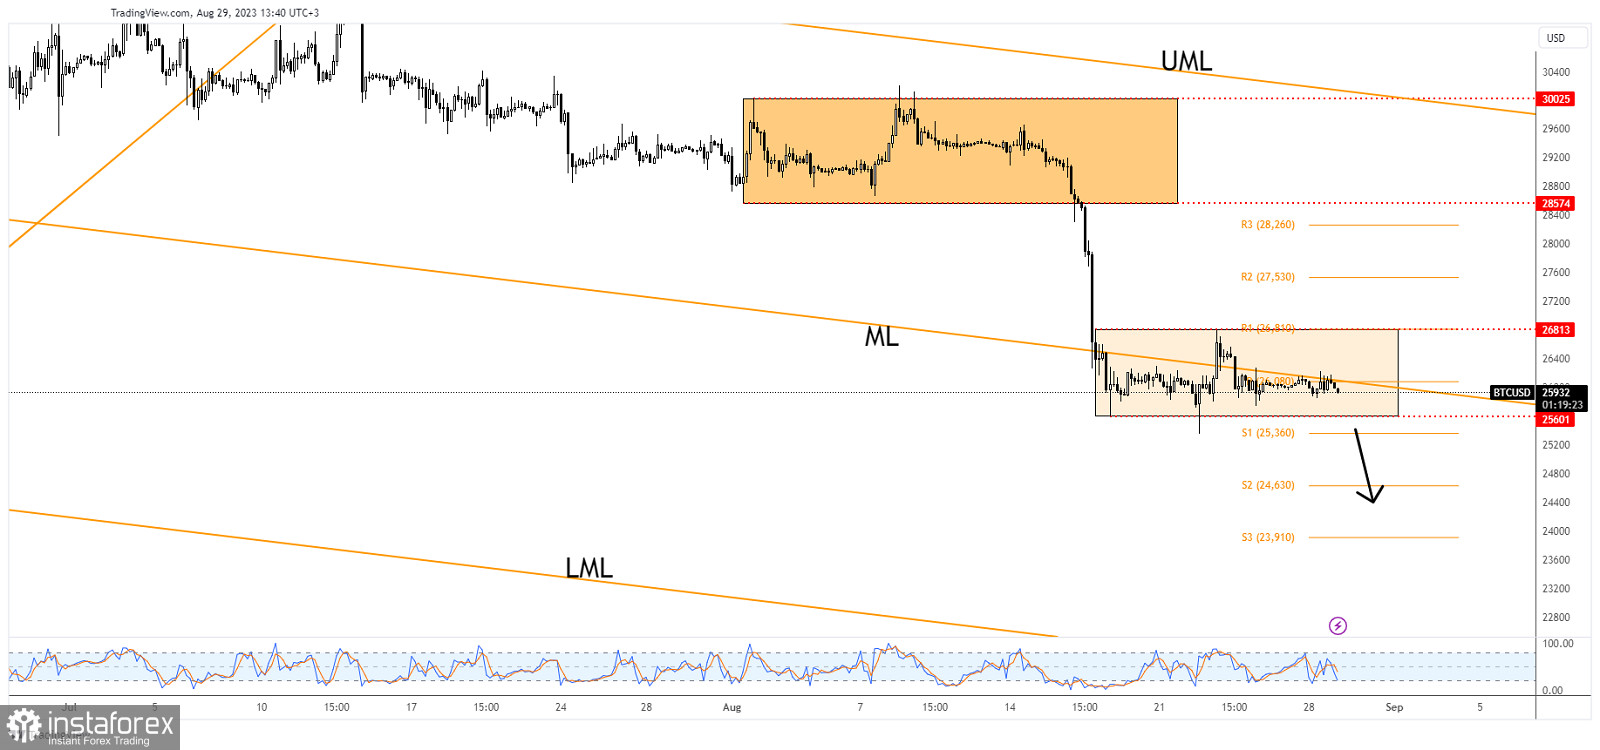
As you can see on the H1 chart, BTC/USD continues to stay below the median line (ML). This represents a dynamic resistance. I've told you that the crypto could drop deeper as long as it stays below the median line (ML).
Technically, only escaping from the current range could bring new opportunities. After its massive drop, the current sideways movement may represent a distribution pattern.
BTC/USD Outlook!
A valid breakdown below 25,601 confirms a downside continuation and is seen as a new selling opportunity.


