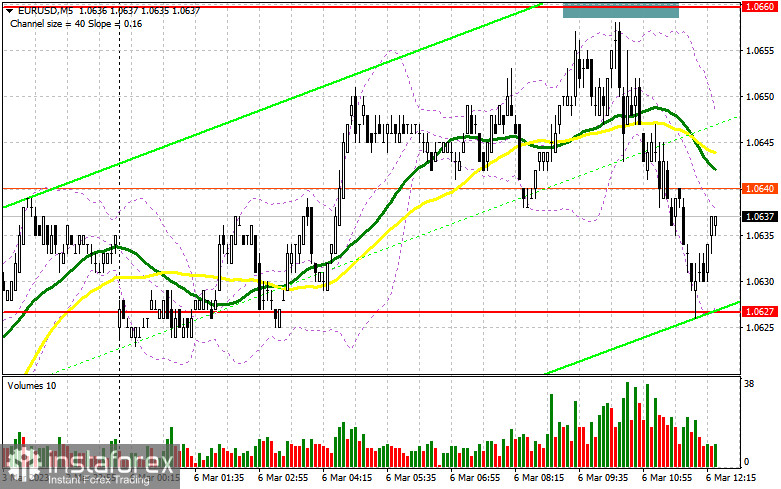
In my morning forecast, I focused on the level of 1.0660 and suggested deciding to enter the market based on it. Let's take a look at the 5-minute chart and see what happened. At this level, there was no growth or formation of a false breakout because exactly one point was missing before the test. Even with such low volatility, it might be challenging to decide whether to enter the market in the absence of clear signals. The technical situation was left unchanged for the remainder of the day.

If you want to trade long positions on EUR/USD, you will need:
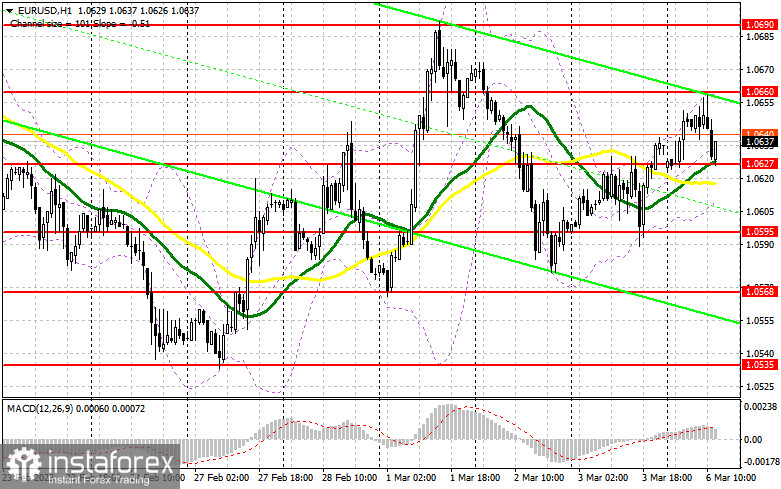
A report on the volume of industrial orders in the US for February of this year is anticipated during the US session, which might increase volatility. Given that buyers are now actively defending the 1.0627 level and have already generated a signal to purchase the euro as a result, it is evident that weak data should help in the implementation of this transaction. The signal is valid as long as the deal is executed above 1.0627. The pressure on the pair will rise if the data comes in higher than economists had anticipated. In this case, maintaining protection of the closest support level of 1.0627, which was created by last Friday's results, is the best-case scenario for the American session. The same resistance level of 1.0660 serves as the target for the recovery; its breakout and top-down test provide a further entry point for developing long positions with a move to 1.0690, where bulls will struggle. When 1.0690 is broken, the stop orders for the bears will be hit, shifting the market and maybe bringing it to 1.0731, where I will fix profits. If this level is tested, it will signal the beginning of a new bull market. The pressure on the pair will return if EUR/USD declines and there are no buyers at 1.0627, where the moving averages are supporting the bulls, and a break of this level will cause a drop to the next support area of 1.0595. Only the emergence of a false collapse will provide a signal to purchase the euro. To achieve an upward corrective of 30-35 points during the day, I will open long positions right away for a rebound from the low of 1.0568, or even lower, around 1.0535.
If you want to trade short positions on EUR/USD, you'll need:
Sellers are not in a hurry and are waiting for Federal Reserve Chairman Jerome Powell's statement in the Senate tomorrow. We are experiencing such minimal volatility, which may continue, for the same reason. After the test and development of a false breakout in the resistance area of 1.0660, which we never achieved, I will merely monitor sales in the afternoon. This will cause sales of the euro to bring the price down to around 1.0627, a level that has already been tested, and it is unlikely that anyone will stay there if the euro continues to fall. The breakdown and reverse test of this range serve as another indication to start short positions with an exit at 1.0595, which will reinstate the market's negative outlook. A more significant drop to the level of 1.0568, where I will take profit, will result from fixing below this range. I encourage you to delay opening short positions until the level of 1.0690 if the EUR/USD moves higher during the American session and there are no bears at the current price of 1.0660. Moreover, you can only sell there following a failed consolidation. In anticipation of a rebound from the high of 1.0731, I will open short options right away with a 30- to 35-point corrective in mind.


Signals from indicators
Moving Averages
Trade is taking place above the 30 and 50-day moving averages, which shows the bulls are trying to maintain their advantage.
Notably, the author considers the time and prices of moving averages on the hourly chart H1 and departs from the standard definition of the traditional daily moving averages on the daily chart D1.
Bands by Bollinger
The indicator's upper bound, or approximately 1.0660, will serve as resistance in the event of an increase.
Description of indicators
- Moving average (moving average determines the current trend by smoothing out volatility and noise). Period 50. The graph is marked in yellow.
- Moving average (moving average determines the current trend by smoothing out volatility and noise). Period 30. The graph is marked in green.
- MACD indicator (Moving Average Convergence / Divergence - moving average convergence/divergence) Fast EMA period 12. Slow EMA period 26. SMA period 9
- Bollinger Bands (Bollinger Bands). Period 20
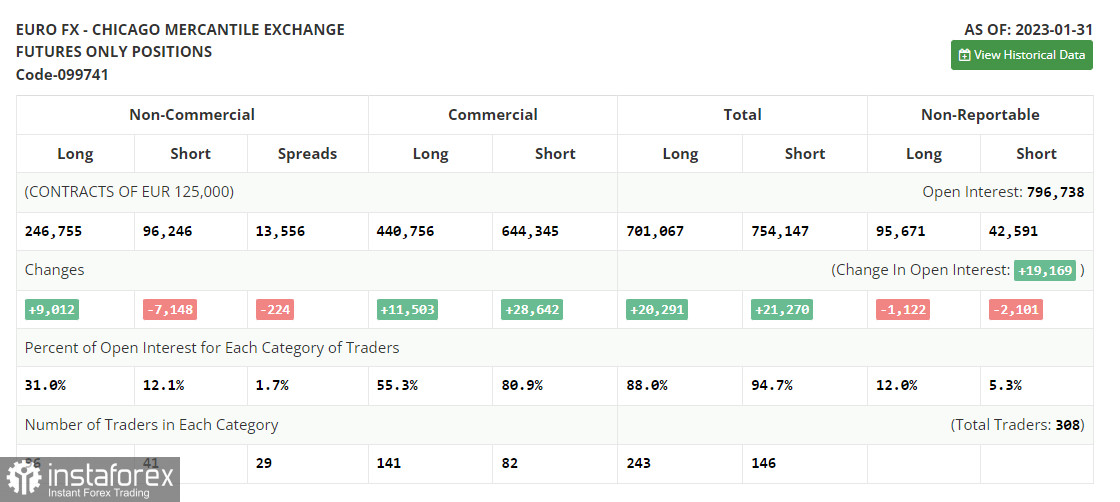
- Non-profit speculative traders, such as individual traders, hedge funds, and large institutions, use the futures market for speculative purposes and to meet certain requirements.
- Long non-commercial positions represent the total long open position of non-commercial traders.
- Short non-commercial positions represent the total short open position of non-commercial traders.
- Total non-commercial net position is the difference between the short and long positions of non-commercial traders.


