Overview :
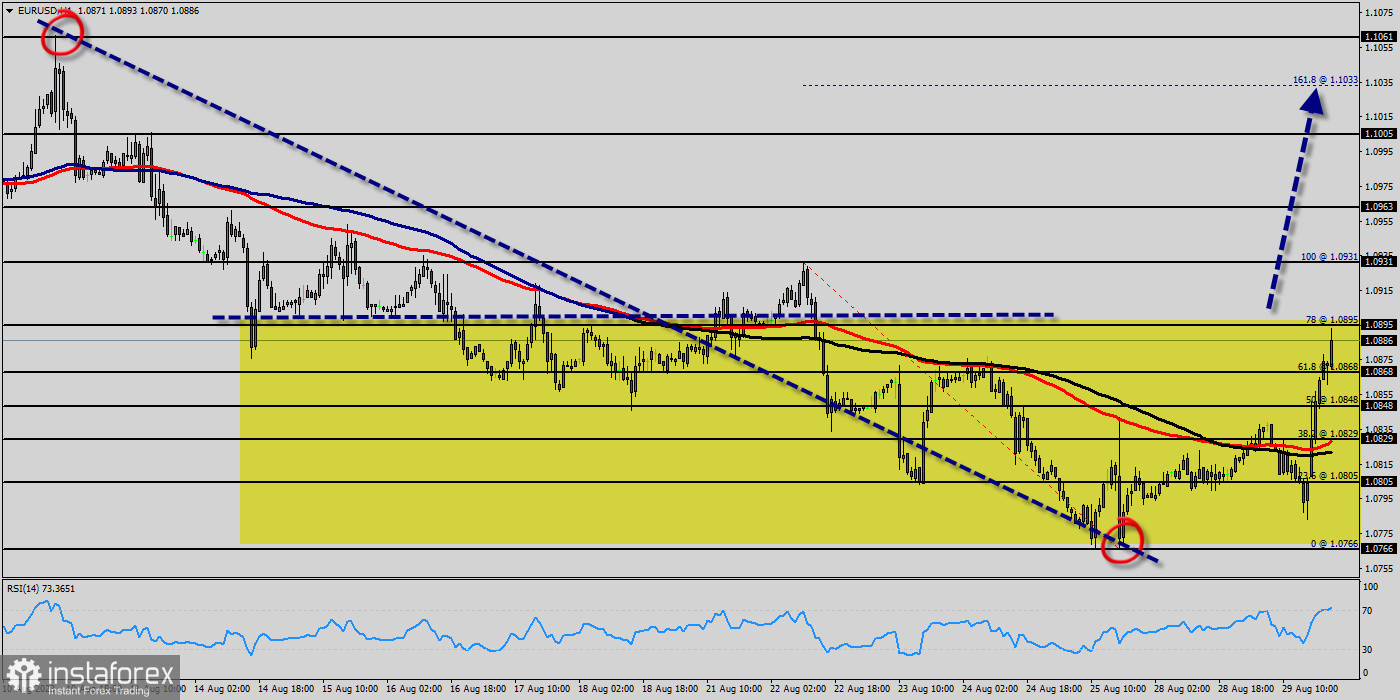
The EUR/USD pair dropped to 1.1004 after the release of the strong news minutes, reaching its lowest level since Tuesday. The pair has a bearish tone ahead of the Asian session as market participants prepare to analyze the upcoming US labor market data. The outlook is turning negative for the Euro after the EUR/USD pair dropped below the 50-day SMA.
Technical indicators in the daily chart point to the downside, with the Relative Strength Index (RSI) moving south breaking under 55. Together with the price below the 50-day SMA, this offers a bearish signal. The negative tone will ease if the Euro manages to post a daily close above 1.1003. The EUR/USD pair fell sharply from the level of 1.0923 towards 1.0855.
Now, the price is set at 1.0855 to act as a daily pivot point. It should be noted that volatility is very high for that the EUR/USD pair is still moving between 1.0923 and 1.0800 in coming hours. Furthermore, the price has been set below the strong resistance at the levels of 1.0923 and 1.0889, which coincides with the 61.8% and 38.2% Fibonacci retracement level respectively.
That said, there was some positive economic news earlier, with French industrial production rising 1.2% on the month in August, considerably stronger than the fall of 0.2% expected. Additionally, the price is in a bearish channel now. Amid the previous events, the pair is still in a downtrend. From this point, the EUR/USD pair is continuing in a bearish trend from the new resistance of 1.0923.
Thereupon, the price spot of 1.0923 remains a significant resistance zone. Therefore, a possibility that the EUR/USD pair will have downside momentum is rather convincing and the structure of a fall does not look corrective. It'll indicate a bearish opportunity below 1.0923, sell below 1.0923 or 1.0889 with the first targets at 1.0836 (the double bottom is seen at 1.0836) - Support 2 has already set at the level of 1.0794. However, the stop loss should be located above the level of 1.0923.
On the one-hour chart, the current rise will remain within a framework of correction. However, if the pair fails to pass through the level of 1.1076 (major resistance), the market will indicate a bearish opportunity below the strong resistance level of 1.1013. This resistance (1.1013) has been rejected several times confirming the downtrend.
The US dollar's strong gains against the Euro have continued today ahead of the sturdy news. The common currency reached a high of more than three week earlier this morning. This technical analysis of EURUSD looks at the one-hour chart. The highest price that EUR/USD reached for that period was 1.1076 (last bullish wave - top).
The lowest price that the EUR/USD pair reached during that period was 1.0950 (right now). Thus, the EUR/USD pair settled below 1.0950 and is testing the support level at 1.0910. RSI and Moving averages continue to give a very strong sell signal with all of the 50 and 100 EMAs successively above slower lines and below the price. The 50 EMA has extended further below the 100 this week.
Support from MAs comes initially from the value zone between the 50 and 100 EMAs. Industriously, Euro Is Losing ground against U.S. Dollar around -95 pips. Additionally, the RSI starts signaling a downward trend. As a result, if the EUR/USD pair is able to break out the first support at 1.0910, the market will decline further to 1.0850 in order to test the weekly support 2.
The pair will probably go down because the downtrend is still strong. Consequently, the market is likely to show signs of a bearish trend. Since there is nothing new in this market, it is not bullish yet. So, it will be good to sell below the level of 1.1013 with the first target at 1.0910 and further to 1.0850. At the same time, the breakdown of 1.0500 will allow the pair to go further up to the levels of 1.1013 in order to retest the weekly top.


