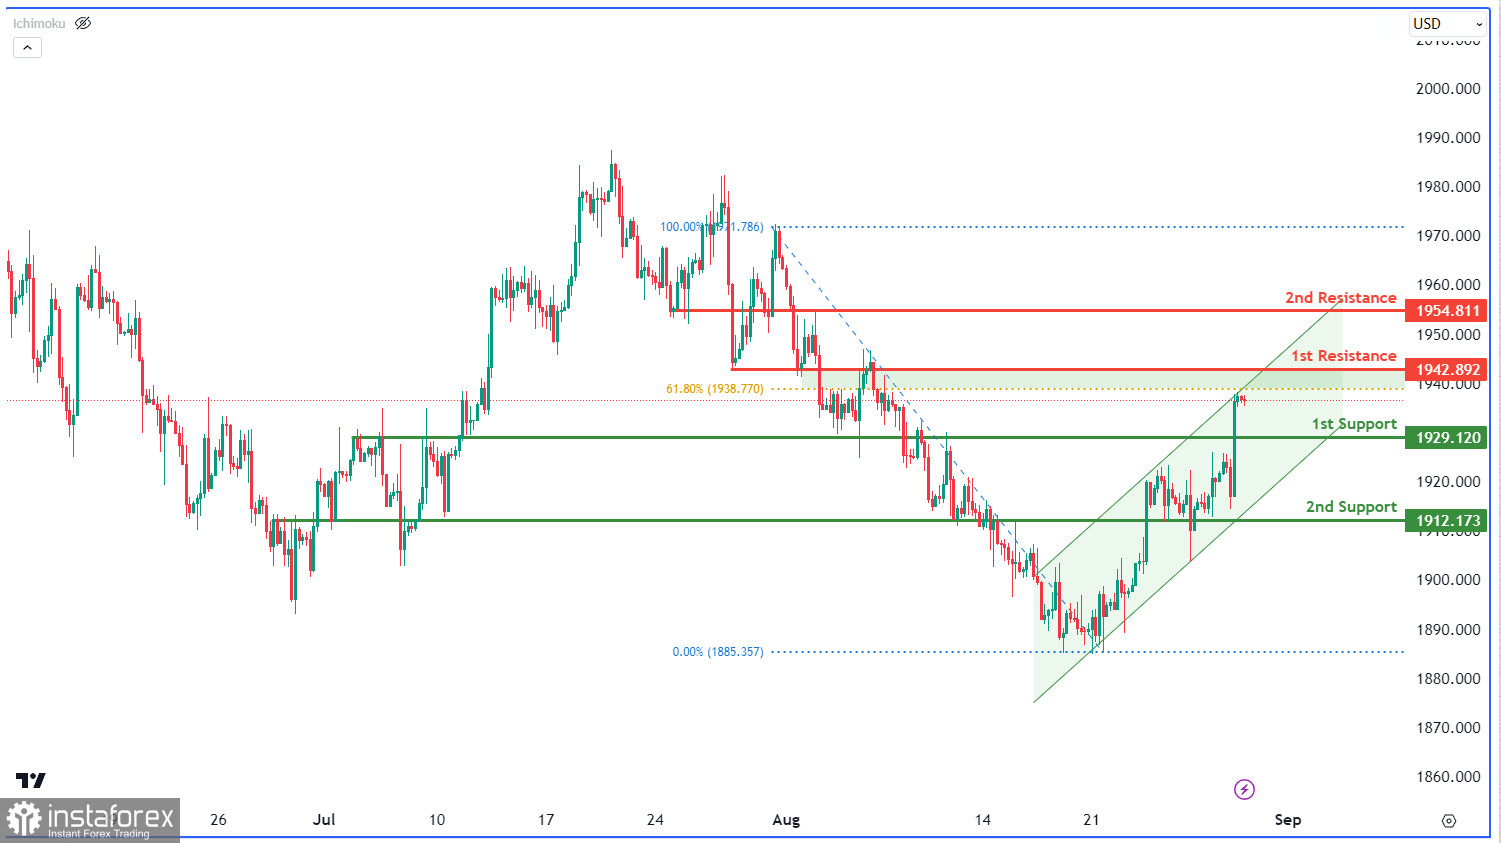
The XAU/USD chart indicates bullish momentum, supported by its position within a bullish ascending channel. Potential price movements involve the 1st support at 1929.12 as a pullback support and the 2nd support at 1912.17 as an overlap support.
On the upside, the 1st resistance at 1942.89 and the 2nd resistance at 1954.81 are both overlap resistances, highlighting levels of historical significance for potential reversals or continuation patterns.


