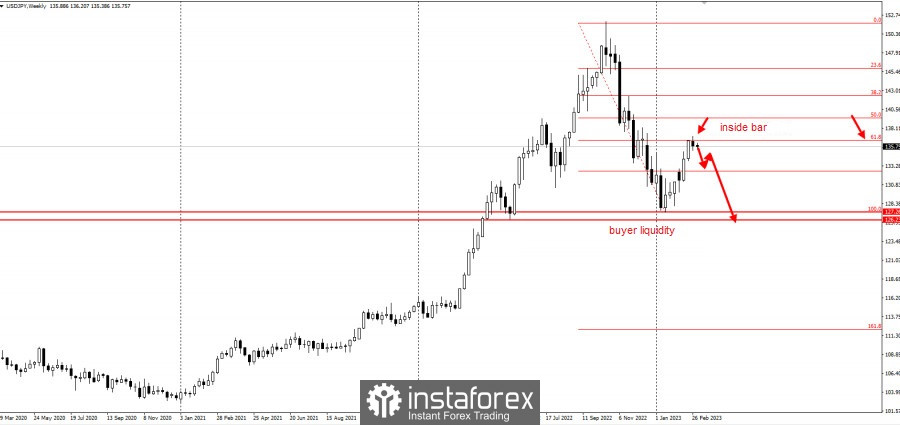
USD/JPY closed with a slowdown last week, probably indicating the end of the bullish correction and the start of a large-scale price decrease in the pair.

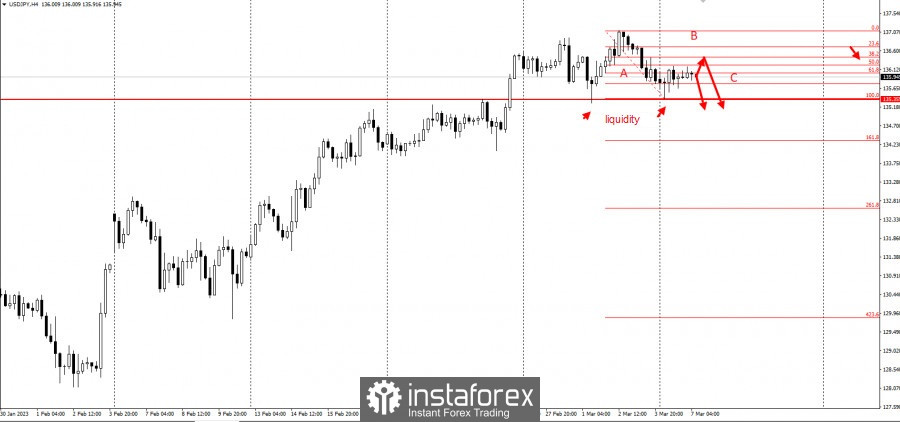
On the 4-hour chart, traders can clearly see the support level of 135.3, behind which is where buyer liquidity has accumulated. This opens the way for a breakdown of 133.4.

In fact, there is already a three-wave (ABC) pattern, in which wave "A" represents the bearish pressure last week. Traders can enter the market by selling from the 50% retracement level, with stop-loss set at 137. Exit by taking profit upon breakdown of 135.3 and 127.0.
This trading idea is based on the "Price Action" and "Stop hunting" methods.
Good luck and have a nice day! Don't forget to control the risks.


