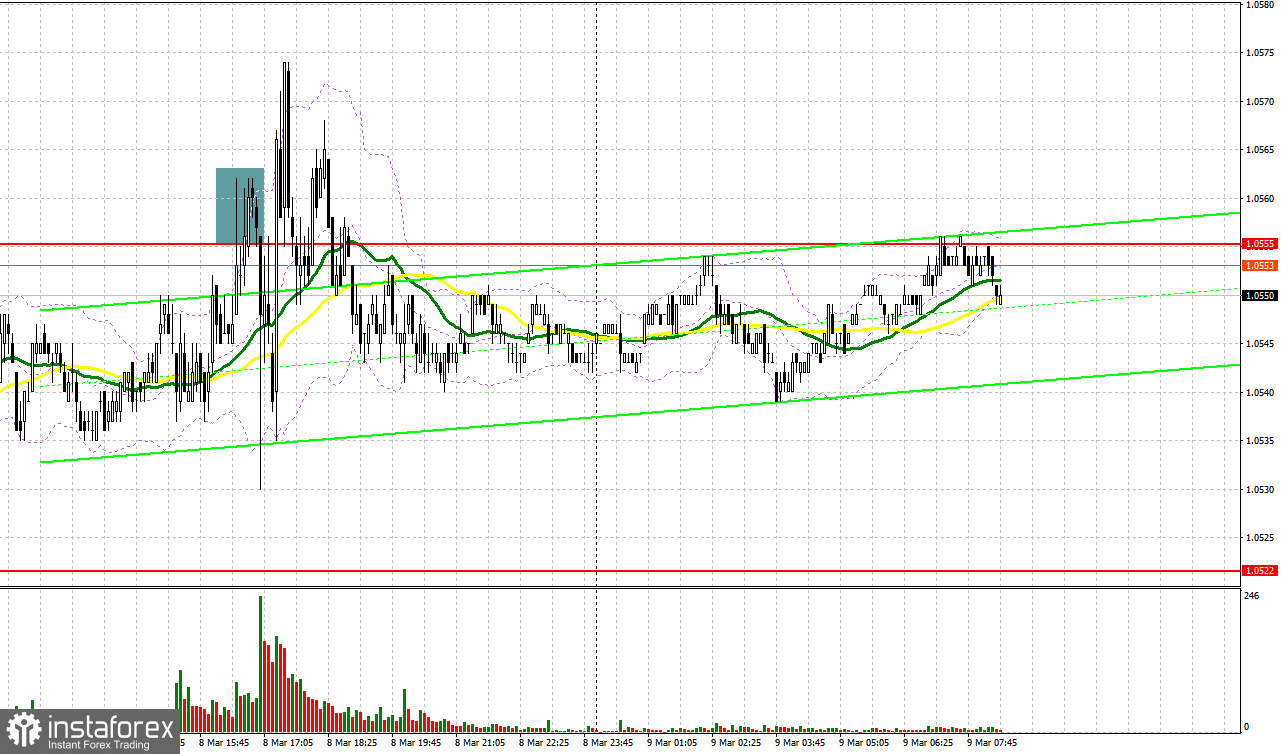
Yesterday, the pair formed only one entry signal. Let's discuss what happened on the 5-minute chart. In my morning review, I mentioned the level of 1.0555 as a possible entry point. The price tested this level only in the North American session. Its false breakout generated a sell signal and the euro fell by more than 20 pips. However, the pair failed to leave the sideways channel and test the level of 1.0522.

For long positions on EUR/USD:
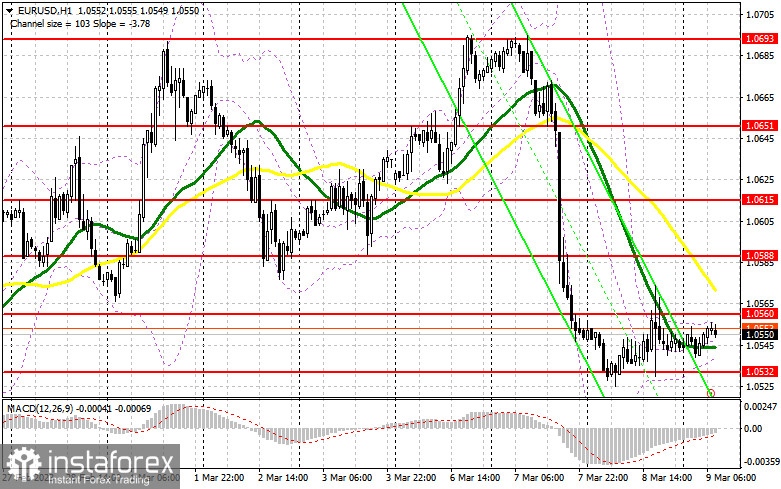
Today the euro bulls have an opportunity to build an upside correction amid an almost empty economic calendar. The change in employment data in France is of little interest to the market. So, the main focus will be on the second half of the day. So the best scenario for the European session will be to keep the price at the nearest support level of 1.0532 that was formed yesterday. Its false breakout may send the pair higher to the new resistance of 1.0560. If broken through and tested downwards, this level could be a good point for adding long positions with the upward target at 1.0588. This is where bulls may face an obstacle. A break above 1.0588 will trigger stop-loss orders set by the bears. If so, a buy signal could push the pair up to the next target at 1.0615 where I will be taking profit. A test of this level will indicate the end of the bullish correction that happened after a sell-off this week. If EUR/USD declines, and bulls are idle at 1.0532, the pair will come under pressure. A breakout of this level will send the price lower to the next support at 1.0487. A new buy signal will be formed only after a false breakout. I will buy the euro right after a rebound from the low of 1.0451 or 1.0395, bearing in mind an upside intraday correction of 30-35 pips.
For short positions on EUR/USD:
Yesterday, bears tried to take advantage of positive data on the US labor market but they failed to succeed. I doubt that today we will see traders selling the pair. So, it is better to trade on an upward movement from the nearest resistance levels. The best moment to open short positions will be a rise to the new resistance of 1.0560 and its false breakout. This may result in the euro falling to a key weekly low of 1.0532. A breakout of this range and its retest amid the downbeat data in the eurozone will give us an additional sell signal with the target at 1.0487. This will intensify the bearish bias. A firm hold below this range will help extend the decline of the pair toward 1.0451 where I will be taking profit. If EUR/USD advances in the European session and bears are idle at 1.0560, it is better to wait until the price hits the level of 1.0588. You can sell the pair from this level only after a failed attempt to settle there. I will go short right from the high of 1.0615, considering a downward correction of 30-35 pips.

COT report
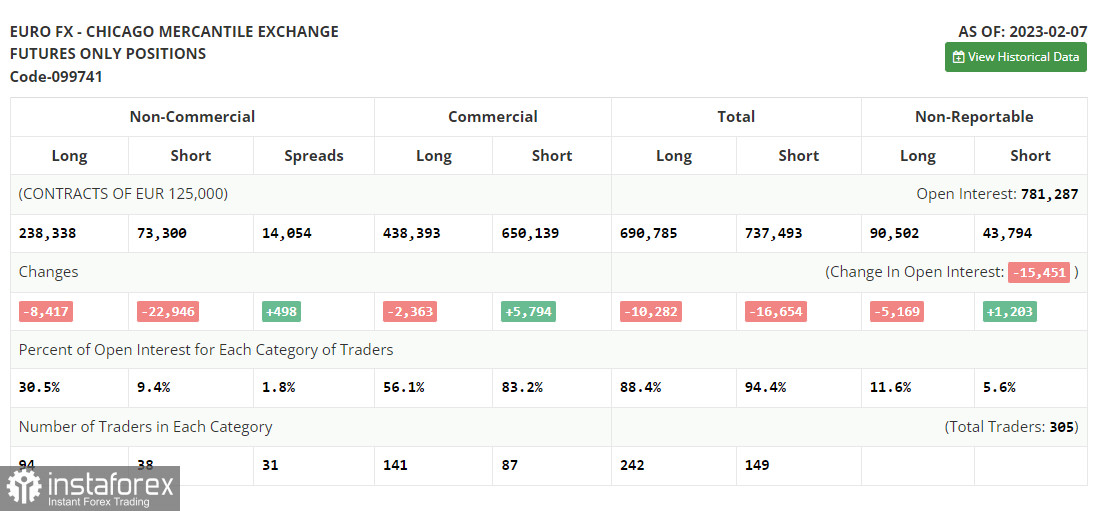
The Commitments of Traders report for February 7 recorded a drop in both long and short positions. Apparently, this change happened on the back of the Fed and ECB decisions on interest rates. However, this data is not of big importance right now. After a cyber attack on the CFTC, fresh figures are not out yet so the data from a month ago is actually not that relevant. Let's wait for new COT reports to get a better understanding of the market. The speech by Jerome Powell will help determine the trajectory of the US dollar in the coming month up until the policy meeting in late March. Hawkish comments about inflation and monetary policy will boost demand for USD and will push the euro lower. If the market gets no new clues, the dollar will continue to ease. According to the COT report, long positions of the non-commercial group of traders declined by 8,417 to 238,338, while short positions dropped by 22,946 to 73,300. The non-commercial net position increased to 165,038 from 150 509. The weekly closing price declined to 1.0742 from 1.0893.

Indicator signals:
Moving Averages
Trading near the 30- and 50-day moving averages indicates market uncertainty ahead of the data release.
Please note that the time period and levels of the moving averages are analyzed only for the H1 chart, which differs from the general definition of the classic daily moving averages on the D1 chart.
Bollinger Bands
In case of a decline, the lower band of the indicator at 1.0545 will act as support.
Description of indicators:
• A moving average of a 50-day period determines the current trend by smoothing volatility and noise; marked in yellow on the chart;
• A moving average of a 30-day period determines the current trend by smoothing volatility and noise; marked in green on the chart;
• MACD Indicator (Moving Average Convergence/Divergence) Fast EMA with a 12-day period; Slow EMA with a 26-day period. SMA with a 9-day period;
• Bollinger Bands: 20-day period;
• Non-commercial traders are speculators such as individual traders, hedge funds, and large institutions who use the futures market for speculative purposes and meet certain requirements;
• Long non-commercial positions represent the total number of long positions opened by non-commercial traders;
• Short non-commercial positions represent the total number of short positions opened by non-commercial traders;
• The non-commercial net position is the difference between short and long positions of non-commercial traders.


