


Analyzing Thursday's trades:
EUR/USD on 30M chart
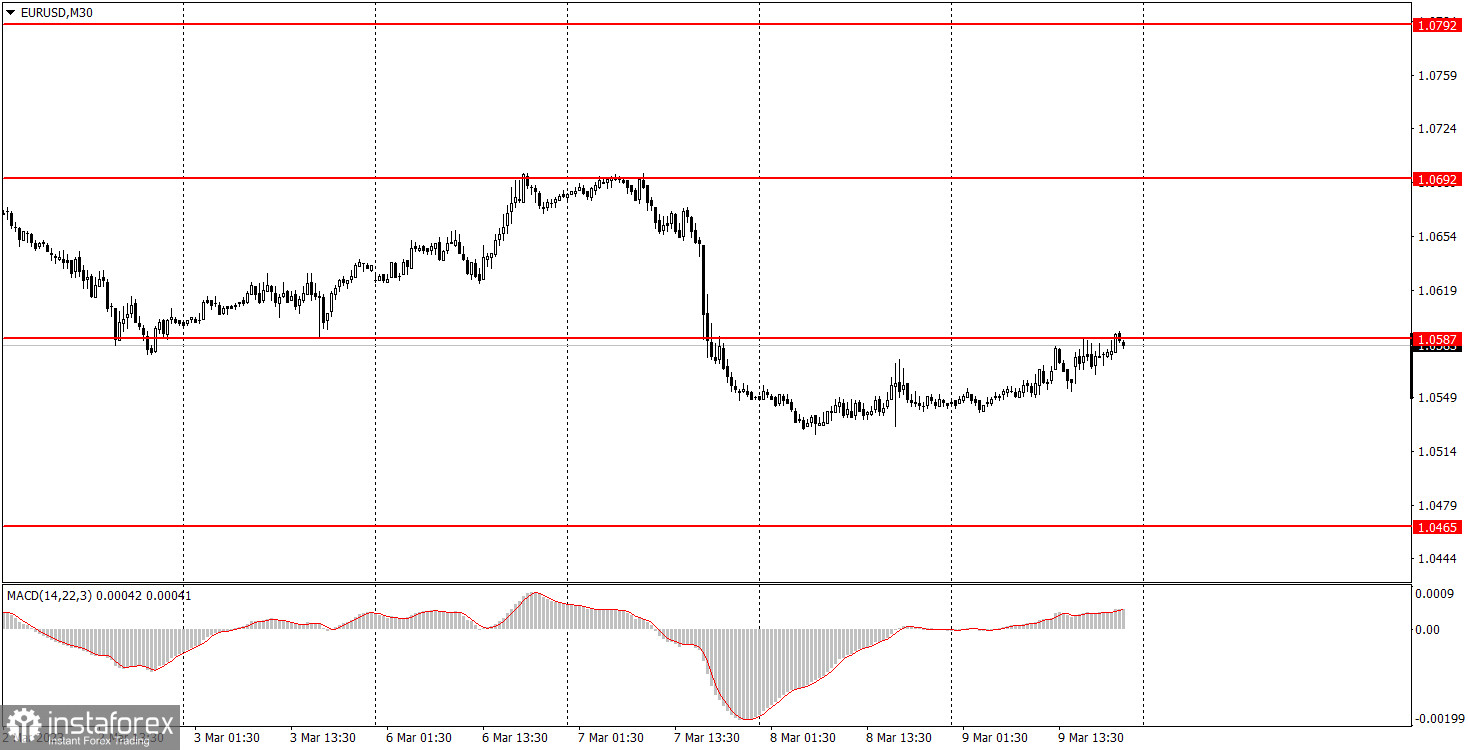
EUR/USD continued the sluggish correction, which had started on Wednesday. The pair showed "super volatility", equal to 50 pips, but still managed to continue its upward movement. Anyway, the movement was very weak, just like the previous day. The only difference is that on Wednesday, the fundamental and macroeconomic background was present, while it wasn't on Thursday. Thus, the pair crawled to 1.0587, but it is difficult to expect a clear rebound or breakthrough because of the weak movement. However, the momentum may get stronger on Friday, because the most important data of the week, NonFarm Payrolls and unemployment data, will be released in the U.S. Of course, the latter might be neutral. Or they both might be neutral and not cause any market reaction, but we can say the same thing about any other event or report. That's why we have to wait for Friday and see what will happen.
EUR/USD on 5M chart
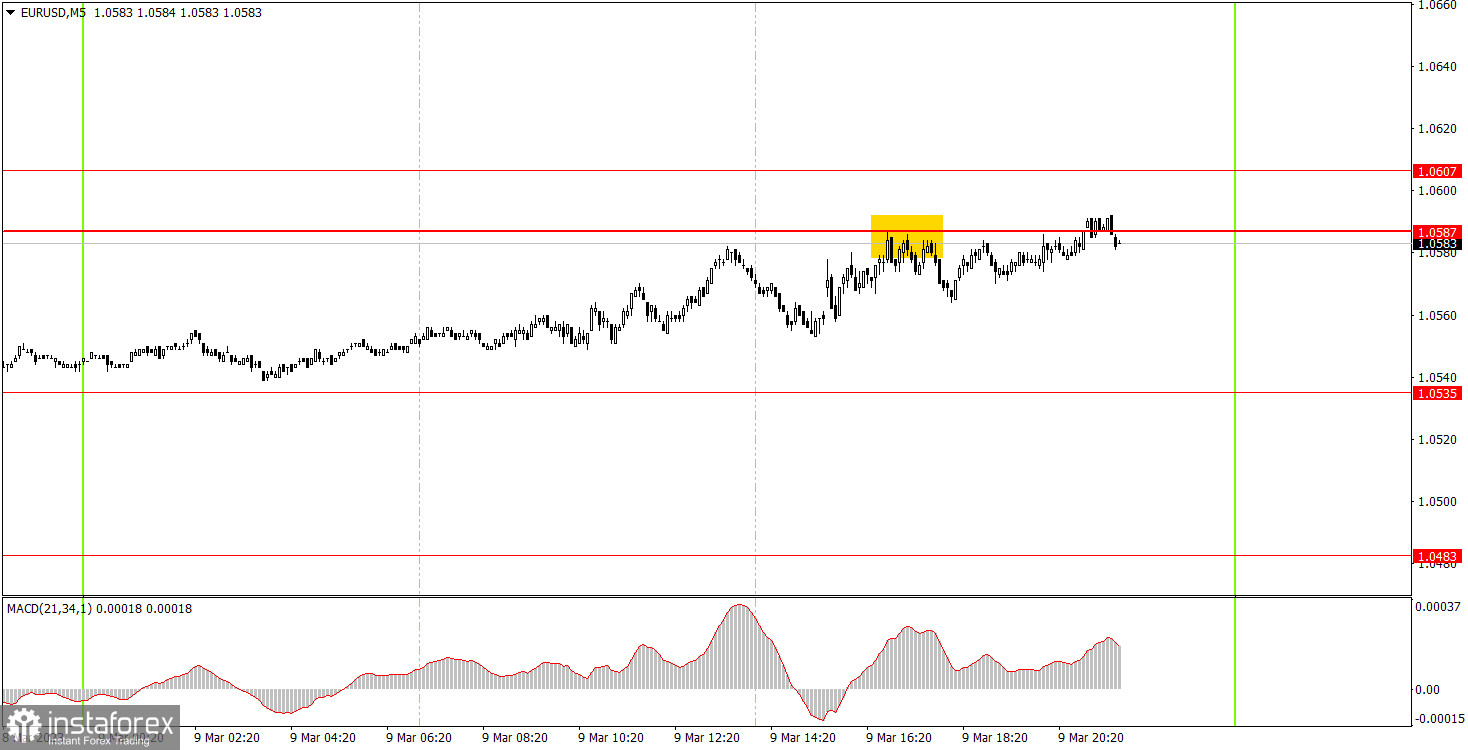
On the 5-minute chart, the pair reached 1.0587 and rebounded from it only by the middle of the U.S. session. This was the only trading signal of the day. But what's the sense in such a trend if volatility was 50 pips? Beginners could open a short position on the signal, but then it was very difficult to gain profit or loss from it. This is because there was almost no movement. By the end of the day, the price failed to form either a buy or sell signal. Therefore, it was necessary to close this position manually in the evening.
Trading tips on Friday:
On the 30-minute chart, the pair is trying to form a medium-term downtrend, but there were no fundamental and macroeconomic backgrounds. The situation should change on Friday, but it does not have to do so. But the macroeconomic background will be very strong on Friday, but which of the currencies will it support: the euro or the USD? On the 5-minute chart, it is recommended to trade at the levels 1.0433, 1.0465-1.0483, 1.0535, 1.0587-1.0607, 1.0692, 1.0792, 1.0857-1.0867. As soon as the price passes 15 pips in the right direction, you should set a Stop Loss to breakeven. On Friday, European Central Bank President Christine Lagarde will give a speech in the European Union, this is the second one this week. I don't expect any big announcements from Lagarde. In America, the Nonfarm and unemployment reports are the key reports this week. I think that the market will have a strong reaction almost in any case, as these reports will largely determine what decisions the Fed will make on March 21-22.
Basic rules of the trading system:
1) The strength of the signal is determined by the time it took the signal to form (a rebound or a breakout of the level). The quicker it is formed, the stronger the signal is.
2) If two or more positions were opened near a certain level based on a false signal (which did not trigger a Take Profit or test the nearest target level), then all subsequent signals at this level should be ignored.
3) When trading flat, a pair can form multiple false signals or not form them at all. In any case, it is better to stop trading at the first sign of a flat movement.
4) Trades should be opened in the period between the start of the European session and the middle of the US trading hours when all positions must be closed manually.
5) You can trade using signals from the MACD indicator on the 30-minute time frame only amid strong volatility and a clear trend that should be confirmed by a trendline or a trend channel.
6) If two levels are located too close to each other (from 5 to 15 pips), they should be considered support and resistance levels.
On the chart:
Support and Resistance levels are the levels that serve as targets when buying or selling the pair. You can place Take Profit near these levels.
Red lines are channels or trend lines that display the current trend and show in which direction it is better to trade now.
The MACD indicator (14, 22, and 3) consists of a histogram and a signal line. When they cross, this is a signal to enter the market. It is recommended to use this indicator in combination with trend patterns (channels and trendlines).
Important announcements and economic reports that can be found on the economic calendar can seriously influence the trajectory of a currency pair. Therefore, at the time of their release, we recommend trading as carefully as possible or exiting the market in order to avoid sharp price fluctuations.
Beginners on Forex should remember that not every single trade has to be profitable. The development of a clear strategy and money management is the key to success in trading over a long period of time.


