Long-term outlook.

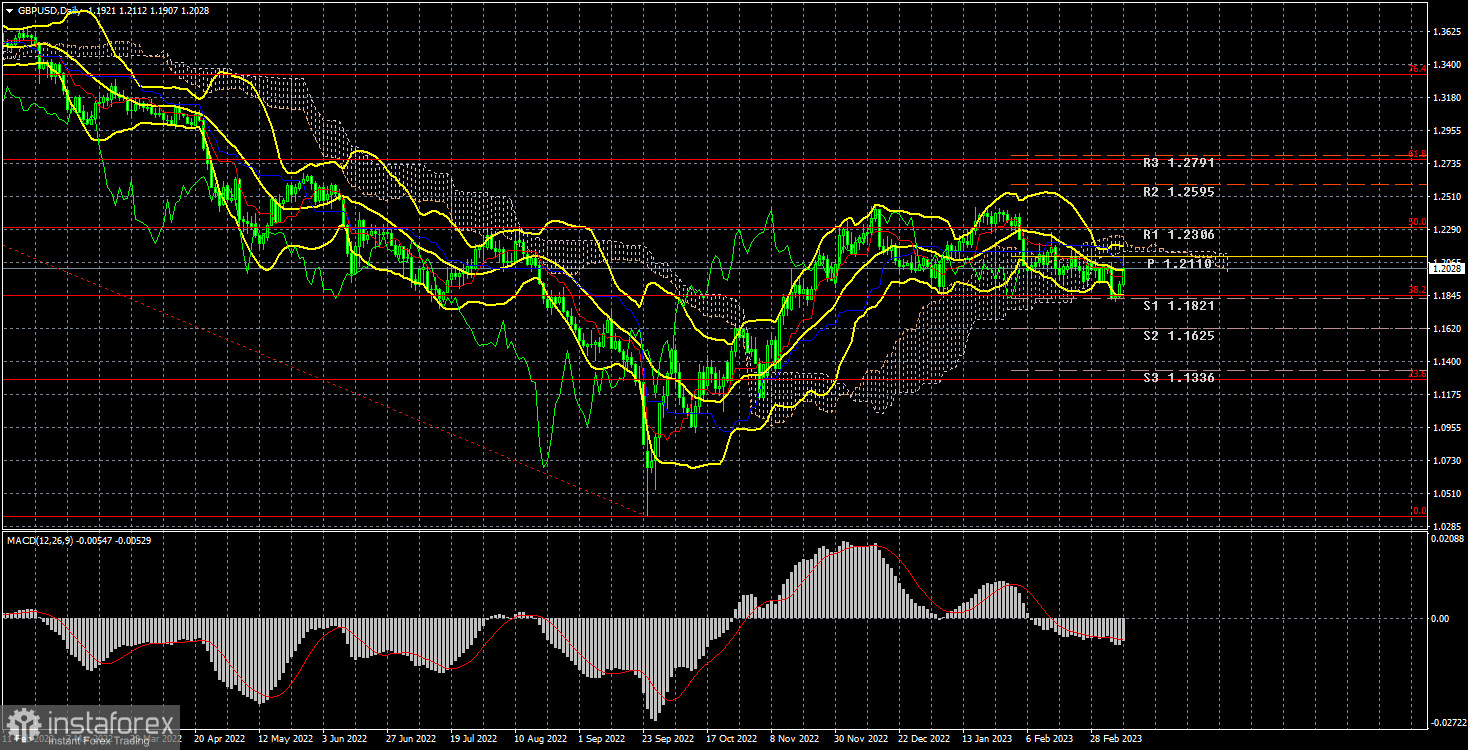
During the current week, the 4-hour TF side channel's lower limit has been broken by the GBP/USD currency pair. The lower border of the side channel for the 24-hour TF, which is plainly shown in the image above, runs 100 points lower. The price, which had dropped by 200 as a result of Jerome Powell's speech to the US Congress, was resting at this limit on Tuesday. Remember that Powell openly acknowledged that the rate of monetary policy tightening might be increased once again and that the key rate might rise for a longer period than anticipated. Consequently, with such a spike in "hawkish" rhetoric, there could be no other option except for the dollar to rise again. On the 24-hour TF, however, it was not possible to break out of the channel, so a rebound from its lower border and new growth of the pair on Wednesday, Thursday, and Friday followed. The pair continues to be inside the side channel even though the minimal downward slope is still present. As a result, we must wait till the level of 1.1841 (38.2% Fibonacci) has been overcome. The Ichimoku indicator's lines are now largely irrelevant.
We're still waiting for the British pound to fall since there aren't any other options right now. Remember that the pair increased by 2,100 points in a short period or 50% of the entire downward trend that lasted for two years. There has been a frank flat in the last three months, so generally speaking, nothing long-term interesting is happening right now. Like the Fed, the Bank of England will keep raising interest rates, but nobody is certain of the extent or upper bound. And the answer to this issue will determine the future of the British pound. From a fundamental standpoint, we think the dollar has a greater justification for growth. Likewise with technical.
COT evaluation.
The most recent COT report for the British pound, which hasn't been accessible for over a month, shows developments for February 21. Undoubtedly, the significance of these reports has decreased over the years, but they are still better than nothing. The Non-commercial group opened 3.3 thousand buy contracts and 4.9 thousand sell contracts during the most recent reporting week. Therefore, there was a 1.6 thousand fall in the net position of non-commercial traders. The net position indicator has been increasing gradually over the past few months, but the major players' outlook is still "bearish," and even though the pound sterling is strengthening against the US dollar (in the longer term), it is quite challenging to determine the basic reasons why. We utterly do not rule out the possibility that the pound may start to decline more rapidly in the near future. Although it has officially started, so far it seems more like a flat. Furthermore take note that both main pairs are currently moving quite similarly, but that the net position for the euro is positive and even suggests that the upward momentum will soon come to an end, while the net position for the pound is negative. A total of 67 thousand sales contracts and 46 thousand purchase contracts have now been opened by the non-commercial group. We continue to be pessimistic about the British pound's long-term growth and anticipate further declines.
Analysis of important events.
This week in the UK, there was essentially nothing interesting. Reports on the GDP and industrial production were only made public on Friday. Yet, considering the current circumstances and fundamental backdrop, industrial production had no possibility of attracting traders, and the GDP report was not quarterly, but monthly. Consequently, despite the pound's continuous growth on Friday, these numbers had essentially little impact on the pair's movements. But how can we connect the strengthening of the pound on Friday with UK data when industrial production turned out to be worse than expected and even negative, and GDP in January was only slightly above expectations? In general, something can no longer be considered reasonable if there was a reaction. We recall that the Wednesday growth of the pair was triggered by a rebound from the level of 1.1841, which was considerably more significant. As we've already mentioned, Powell's speech took place in the States, which was very beneficial to the dollar, and reports on unemployment and nonfarm payrolls were released, which collectively caused the dollar to fall "from heaven to earth." As a result, we once again have a flat, a "swing," or any movement other than a trend.
Trading strategy for the week of March 13–17:
1) The pound/dollar pair is presently in the side channel between 1.1840–1.2440. Short positions are therefore more pertinent right now, although it's unlikely that the pair will emerge from the side channel anytime soon. Thus, we suggest delaying additional sales until the 1.1840 level is broken. Then, taking short positions with a target 300–400 points lower will make sense.
2) Purchases won't be important unless the price is fixed above the crucial line or there is another powerful signal. Yet, given the flat market, even fixing above Kijun-sen does not ensure the rise would resume. Also, purchases are conceivable with recovery from the side channel's lower border with the aim of the higher border, but even in this scenario, things are not always simple because the price may not reach the upper border. After all, the minimal downward trend is still intact.
Explanations for the illustrations:
Fibonacci levels, which serve as targets for the beginning of purchases or sales, and price levels of support and resistance (resistance/support). Take Profit levels may be positioned close by.
Bollinger Bands, MACD, and Ichimoku indicators (standard settings) (5, 34, 5).
The net position size of each trading category is represented by indicator 1 on the COT charts.
The net position size for the "Non-commercial" category is shown by indicator 2 on the COT charts.


