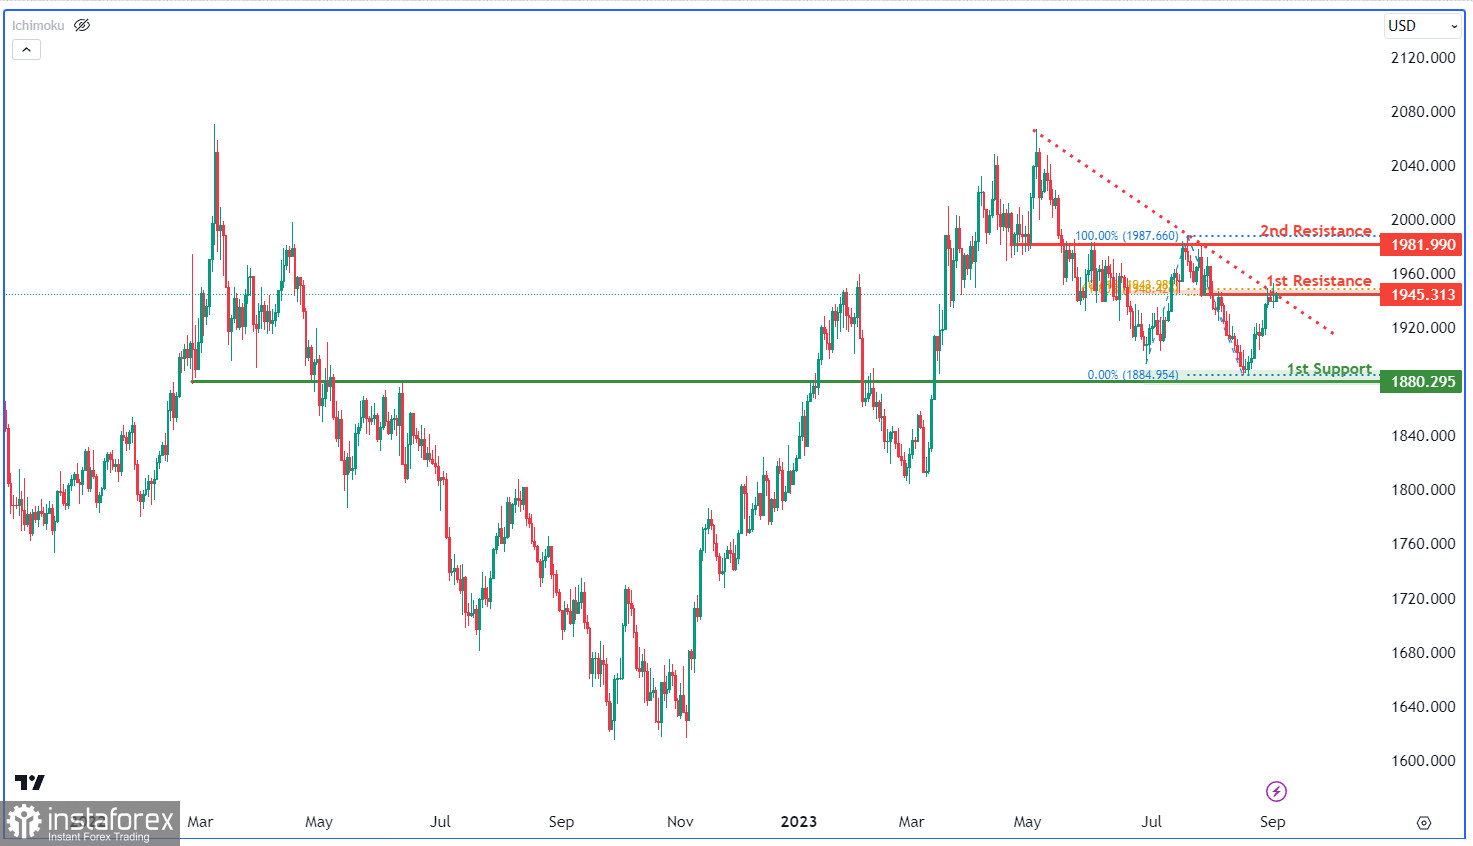
The XAU/USD chart reflects bearish momentum, supported by a descending trend line. A potential scenario involves bearish reaction at the 1st resistance, possibly leading to a drop towards the 1st support at 1880.29, an established historical support level. The 1st resistance at 1945.31, aligned with key Fibonacci levels, is important to monitor, along with the 2nd resistance at 1981.99, which historically resisted price movements.


