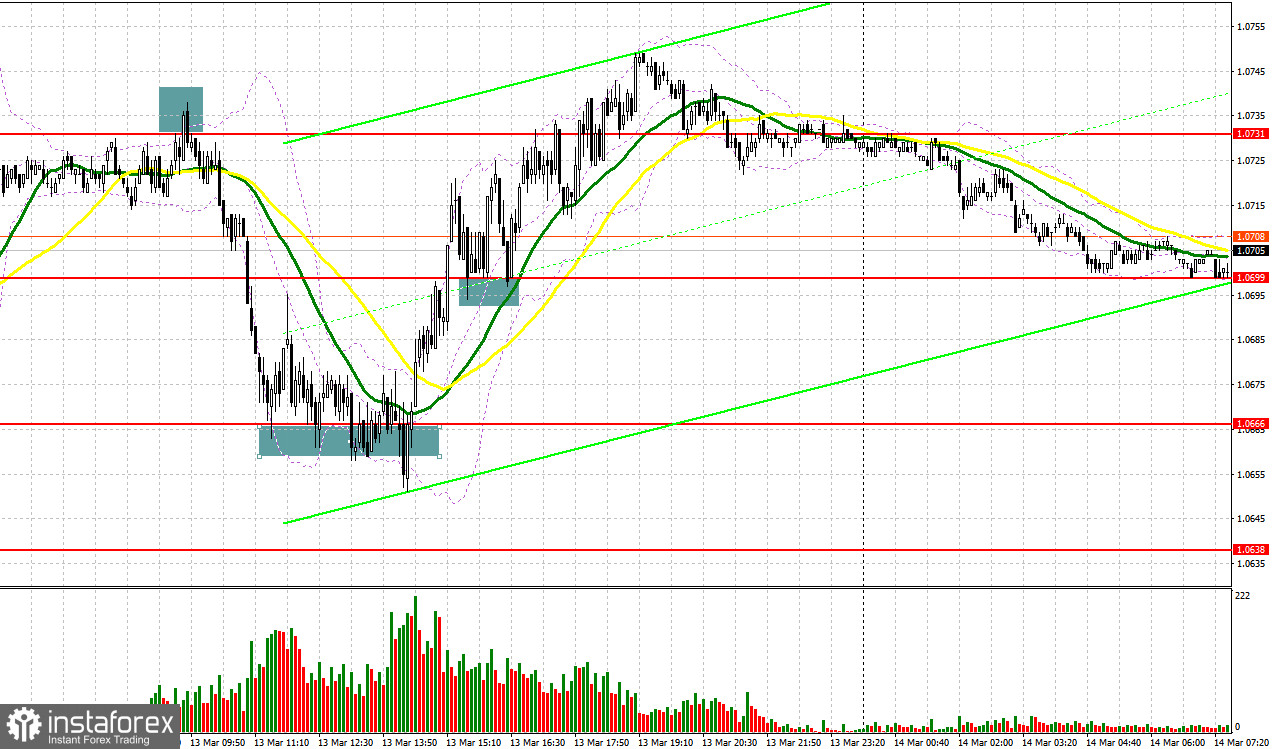
Yesterday, the pair formed several good entry signals. Let's discuss what happened on the 5-minute chart. In my morning review, I mentioned the level of 1.0731 as a possible entry point. A rise to this level and its false breakout served as a sell signal which led to a decline of more than 60 pips. Buyers managed to protect the level of 1.0666, and the price moved up by more than 30 pips. A breakout and a test of the 1.0699 level in the second half of the day generated a buy signal which resulted in a profit of 30 pips.

COT report
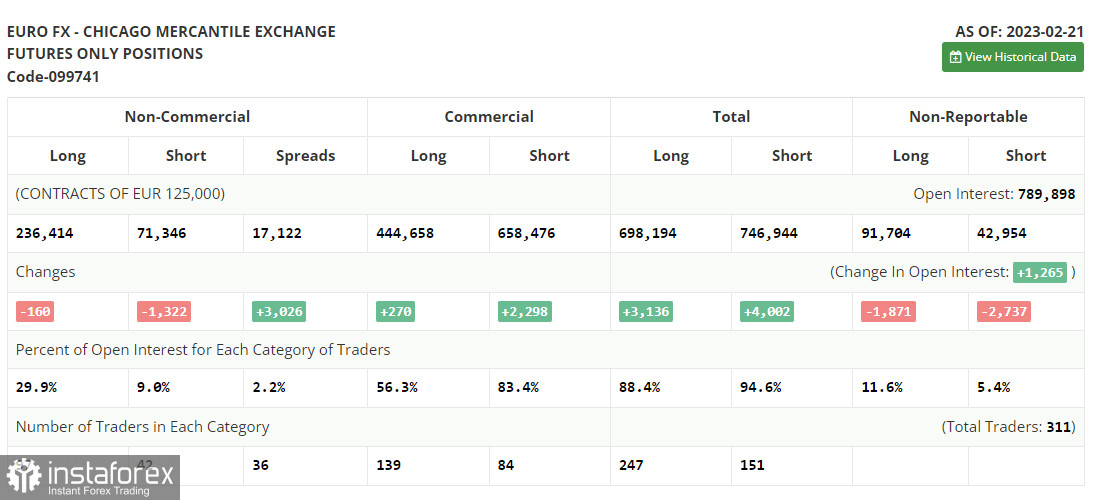
Before proceeding with technical analysis, let's first look at the futures market and the Commitments of Traders report. The Commitments of Traders report for February 21 recorded a drop in both long and short positions. However, this data is not of big importance right now. After a cyber attack on the CFTC, fresh figures are not out yet so the data from a month ago is actually not that relevant. Let's wait for new COT reports to get a better understanding of the market. This week, traders are looking ahead to the inflation data in the US which may support the view about the Fed's possible abandonment of aggressive monetary policy. The risk of a collapse in the US banking sector that emerged after the BSV bankruptcy may change the stance of the Fed officials. Against this backdrop, the regulator may revise the interest rate policy to avoid further damage to the economy. According to the latest COT report, long positions of the non-commercial group of traders dropped by 160 to 236,414 while short positions declined by 1,322 to 71,346. The non-commercial net position increased to 165,038 from 150,509. The weekly closing price fell to 1.0698 from 1.0742.

For long positions on EUR/USD
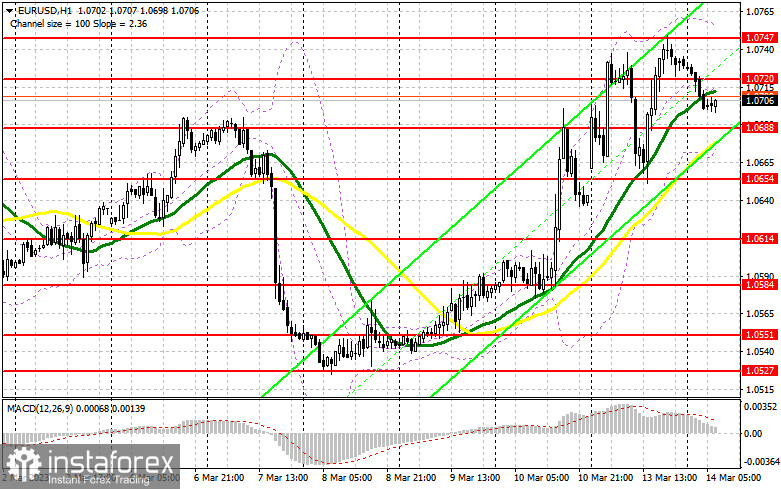
Major trading activity is expected in the second half of the day. So, the euro may start a correction in the European session given positive data on industrial production in Italy and the CPI in Spain. The meeting of the EU council of finance ministers is unlikely to influence the market, unlike the US inflation data that will be discussed later in the day. Therefore, I wouldn't recommend opening long positions at the moment. An opportunity for going long may emerge after a decline to the new support of 1.0688 and its false breakout. This is where moving averages supporting the bulls are found. You may open long positions at this level in anticipation of a further rise to the nearest resistance at 1.0720, from where bulls have retreated in the Asian session. A breakout and a downward retest of this range may push the price up to the monthly high of 1.0747. If so, the pair may head toward the upper target of 1.0775. The high of 1.0800 will act as the most distant target. The price will reach this level only in case of weak CPI data in the US. This will confirm a new cycle of the bullish trend. I am going to take profit at this point. If EUR/USD declines and bulls are idle at 1.0688, which is very likely, the market will hit the balance until the key data on inflation is out. In this case, you can buy the euro only after a false breakout at the next support of 1.0654. I will go long on EUR/USD right after a rebound from the low of 1.0614 or 1.0584, considering an intraday upward correction of 30-35 pips.
For short positions on EUR/USD
Bears have regained control of the 1.0720 level but failed to develop a proper downtrend so far. Bulls will most likely try to break above this level in the first half of the day, so this range should be in focus. The main goal for bears today is to protect the resistance at 1.0720 that was formed yesterday. Its false breakout after the downbeat data in the eurozone will give a sell signal and send the price lower to 1.0688. A breakout of this level and its downward retest will generate an additional sell signal that will trigger stop-loss orders set by the bulls. If so, the pair may fall to 1.0654. It may break below this level only in the second half of the day. The support at 1.0614 will act as the next downward target where I recommend profit taking. If EUR/USD advances in the European session and bears are idle at 1.0720, bulls will maintain control of the market. If so, it would be wise to sell the pair only when it reaches 1.0747. Its false breakout will be another entry point into short positions. I will sell EUR/USD right after a rebound from 1.0775 or 1.0800, keeping in mind a downward correction of 30-35 pips.

Indicator signals:
Moving Averages
Trading above the 30- and 50-day moving averages indicates a further uptrend.
Please note that the time period and levels of the moving averages are analyzed only for the H1 chart, which differs from the general definition of the classic daily moving averages on the D1 chart.
Bollinger Bands
In case of a decline, the lower band of the indicator at 1.0688 will act as support. If the pair advances, the upper band of the indicator at 1.0750 will act as resistance.
Description of indicators:
• A moving average of a 50-day period determines the current trend by smoothing volatility and noise; marked in yellow on the chart;
• A moving average of a 30-day period determines the current trend by smoothing volatility and noise; marked in green on the chart;
• MACD Indicator (Moving Average Convergence/Divergence) Fast EMA with a 12-day period; Slow EMA with a 26-day period. SMA with a 9-day period;
• Bollinger Bands: 20-day period;
• Non-commercial traders are speculators such as individual traders, hedge funds, and large institutions who use the futures market for speculative purposes and meet certain requirements;
• Long non-commercial positions represent the total number of long positions opened by non-commercial traders;
• Short non-commercial positions represent the total number of short positions opened by non-commercial traders;
• The non-commercial net position is the difference between short and long positions of non-commercial traders.


