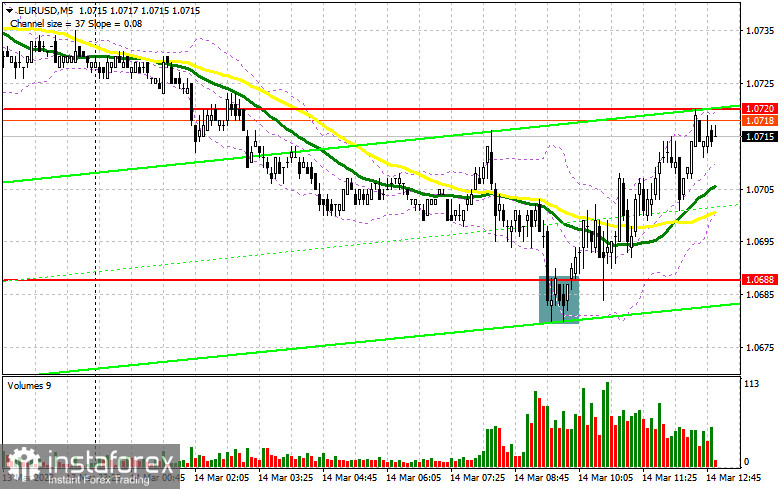
I focused on the 1.0688 level in my morning forecast and suggested making considerations about entering the market from there. Let's take a look at the 5-minute chart and see what happened. At this moment, a decline and a false collapse gave us the signal to purchase euros, which led to a gain of more than 30 points. The technical situation has not changed for the second half of the day.

If you want to trade long positions on EUR/USD, you will need:
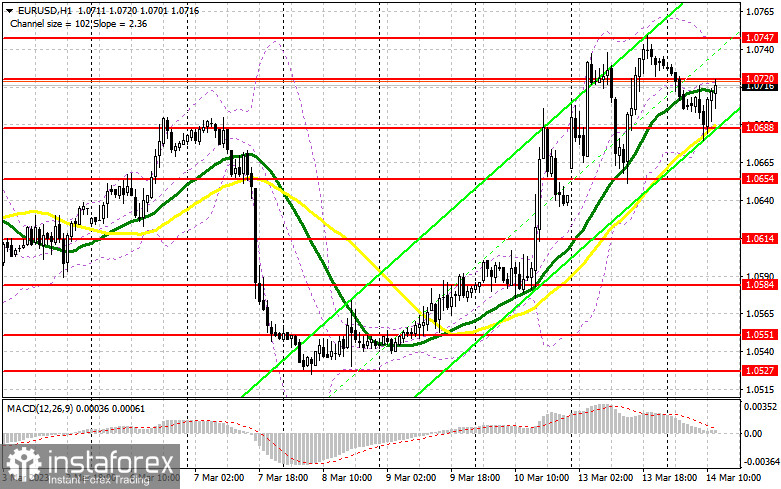
The lack of significant eurozone statistics enabled buyers of the euro to protect 1.0688 and be ready for American data. Reports on inflation are anticipated in the afternoon. The basic consumer price index, which stubbornly refuses to fall, will be critical. The Federal Reserve System will be able to completely forego raising interest rates during the March meeting, which will put even more pressure on the dollar, especially at a time when the regulator is attempting to save its banking system from the crisis. If inflation in the US declines and turns out to be better than anticipated, the pressure on the dollar will only increase. In this situation, increasing interest rates is not the best course of action. The Fed will be forced to further tighten policy if inflation increases. We can only speculate as to how much and by how much the rates will increase in this particular scenario by the end of March. Technically speaking, as I stated before, nothing has changed. Only another false breakout around 1.0688, by analogy with what I stated previously, will enable you to acquire a buy signal if the pair declines, confirming the presence of individuals looking to purchase euros in the afternoon market. Moving averages are another factor working in favor of the bulls. The nearest resistance level of 1.0720 will be the target, which the bulls missed during today's Asian session. A breakout and top-down test of this area will allow us to hit 1.0747, the month's high, giving us more hope for a larger upward movement to 1.0775. The most unlikely target will be a new maximum of 1.0800, which will only be achievable if US inflation figures are poor. I'll set the profit there. Market equilibrium will prevail if EUR/USD declines, which is a possibility, and if there are no buyers at 1.0688 in the afternoon, which is also highly plausible. In this scenario, the only possibility to buy the euro would be a false collapse in the area of the next support level at 1.0654. I will open long positions on EUR/USD immediately for a rebound only from the minimum of 1.0614, or even lower, around 1.0584, with the target of an upward correction of 30-35 points within a day.
To open short positions on EUR/USD, you will need the following:
The sellers' target remains the same: to preserve the 1.0720 resistance created by yesterday's outcomes. The euro will see a second decline to the 1.0688 area if there is a false breakout at this level following information on a sharp increase in prices in the US in February of this year. The collapse and consolidation of this level, as well as the reverse test from the bottom up, provide an additional signal to enter short positions with the destruction of buyers' stop orders, pushing the pair to 1.0654. Beyond this point, there is support around 1.0614, where I advise fixing profits. The bulls will continue to dominate the market if the EUR/USD rises during the US session and there are no bears below 1.0720. In this situation, I suggest delaying sales until 1.0747. The formation of a false breakout there will serve as a new entry point for short positions. To achieve a 30-35 point downward correction, I will sell EUR/USD right away on a recovery from the high of 1.0775, or even higher, from 1.0800.
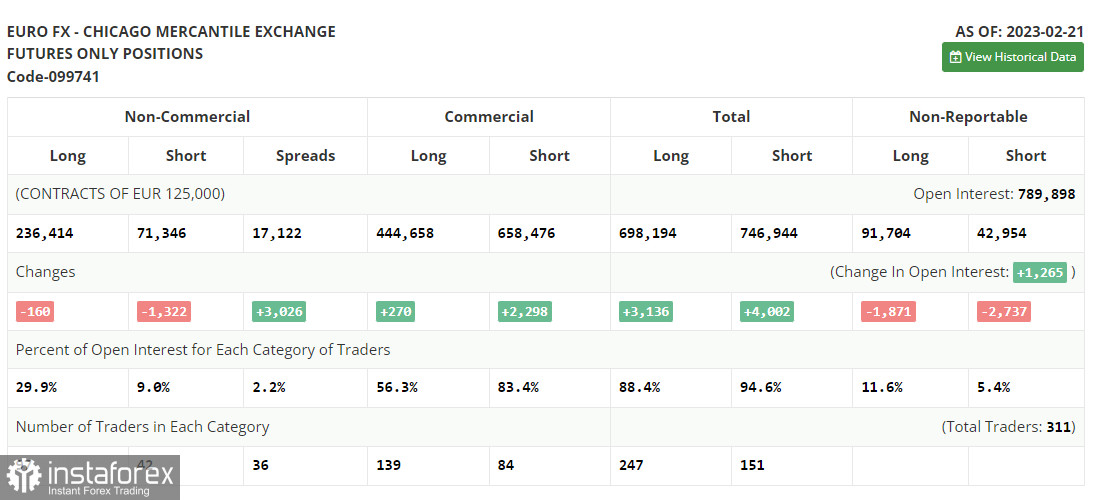
In the COT report (Commitment of Traders) for February 21, fewer long and short positions were reported. The information from a month ago is not very pertinent at this time, so it should be understood that these data are of little interest at this time. This is because statistics are only now starting to catch up following the cyberattack on the CFTC. I'll hold off until new reports are released and rely on more recent data. Inflation in the US is one of the significant events this week, and it could finally increase traders' confidence that the Fed and Jerome Powell won't resume their hard-line stance, as was stated last week. The prospect of the US banking industry collapsing, which emerged during the BSV bankruptcy, would undoubtedly alter Fed policymakers' assessments of how much more they need to raise the rate to "finish off" the economy. According to the COT data, the number of long non-commercial positions fell by 160, to 236,414; the number of short non-commercial positions fell by 1,322, to 71,346. The total non-commercial net position rose to 165,038 from 150,509 after the week. The weekly closing price fell from 1.0742 to 1.0698.

Signals from indicators
Moving Averages
The fact that trading is taking place just above the 30- and 50-day moving averages suggests that the market is optimistic.
Note that the author's consideration of the period and cost of moving averages on the hourly chart H1 differs from the standard definition of the traditional daily moving averages on the daily chart D1.
Bands by Bollinger
The indicator's upper limit, which is located at 1.0747, will serve as resistance in the event of growth.
Description of indicators
- Moving average (moving average determines the current trend by smoothing out volatility and noise). Period 50. The graph is marked in yellow.
- Moving average (moving average determines the current trend by smoothing out volatility and noise). Period 30. The graph is marked in green.
- MACD indicator (Moving Average Convergence / Divergence - moving average convergence/divergence) Fast EMA period 12. Slow EMA period 26. SMA period 9
- Bollinger Bands (Bollinger Bands). Period 20
- Non-profit speculative traders, such as individual traders, hedge funds, and large institutions use the futures market for speculative purposes and to meet certain requirements.
- Long non-commercial positions represent the total long open position of non-commercial traders.
- Short non-commercial positions represent the total short open position of non-commercial traders.
- Total non-commercial net position is the difference between the short and long positions of non-commercial traders.


