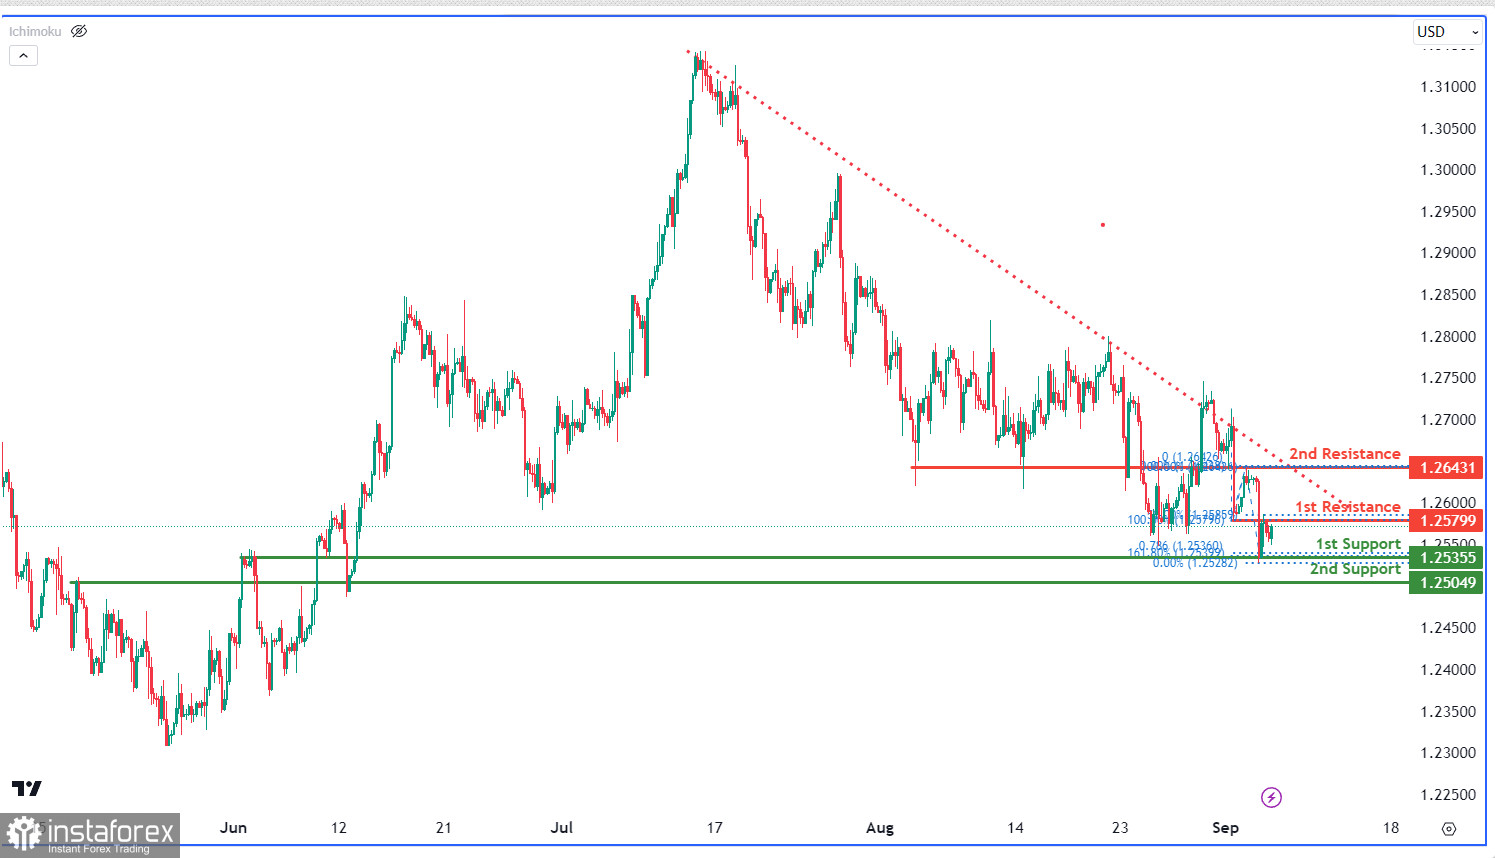
The GBP/USD chart exhibits a bearish momentum, being below a significant descending trend line, hinting at possible continued bearishness. There's potential for a bearish reaction at the 1st resistance, possibly leading to a drop to the 1st support.
The 1st support at 1.2535 is a multi-swing low support, aligning with the 78.60% Fibonacci Projection and the 161.80% Fibonacci Extension, making it a strong potential support level. Another 1st support at 1.2504 is an overlap support, indicating historical support at this level.
On the resistance side, the 1st resistance at 1.2579 and the 2nd resistance at 1.2643 are both overlap resistances, potentially impeding bullish movements


