


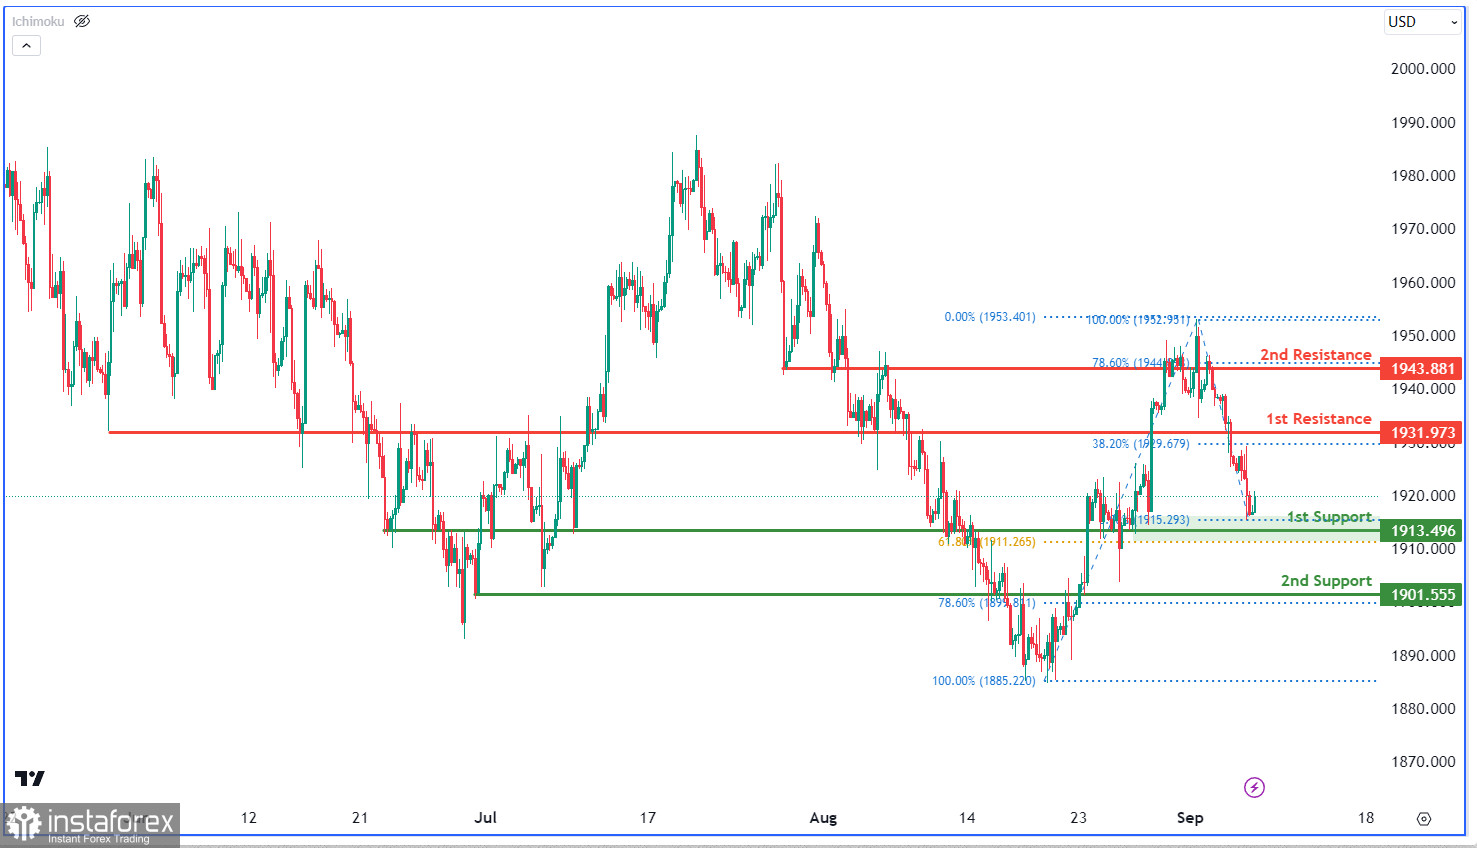
The XAU/USD chart currently shows a bullish trend, indicating a possible upward price movement. There's a chance of a bullish rebound at the first support level of 1913.49, which aligns with the 61.80% Fibonacci Retracement and has historical buying interest. The second support at 1901.55, also an overlap support, reinforces its significance. On the resistance side, the first resistance at 1931.97, associated with the 38.20% Fibonacci Retracement, suggests potential selling interest. Another resistance at 1943.88, marked as an overlap resistance, further supports the potential for a bullish move.


