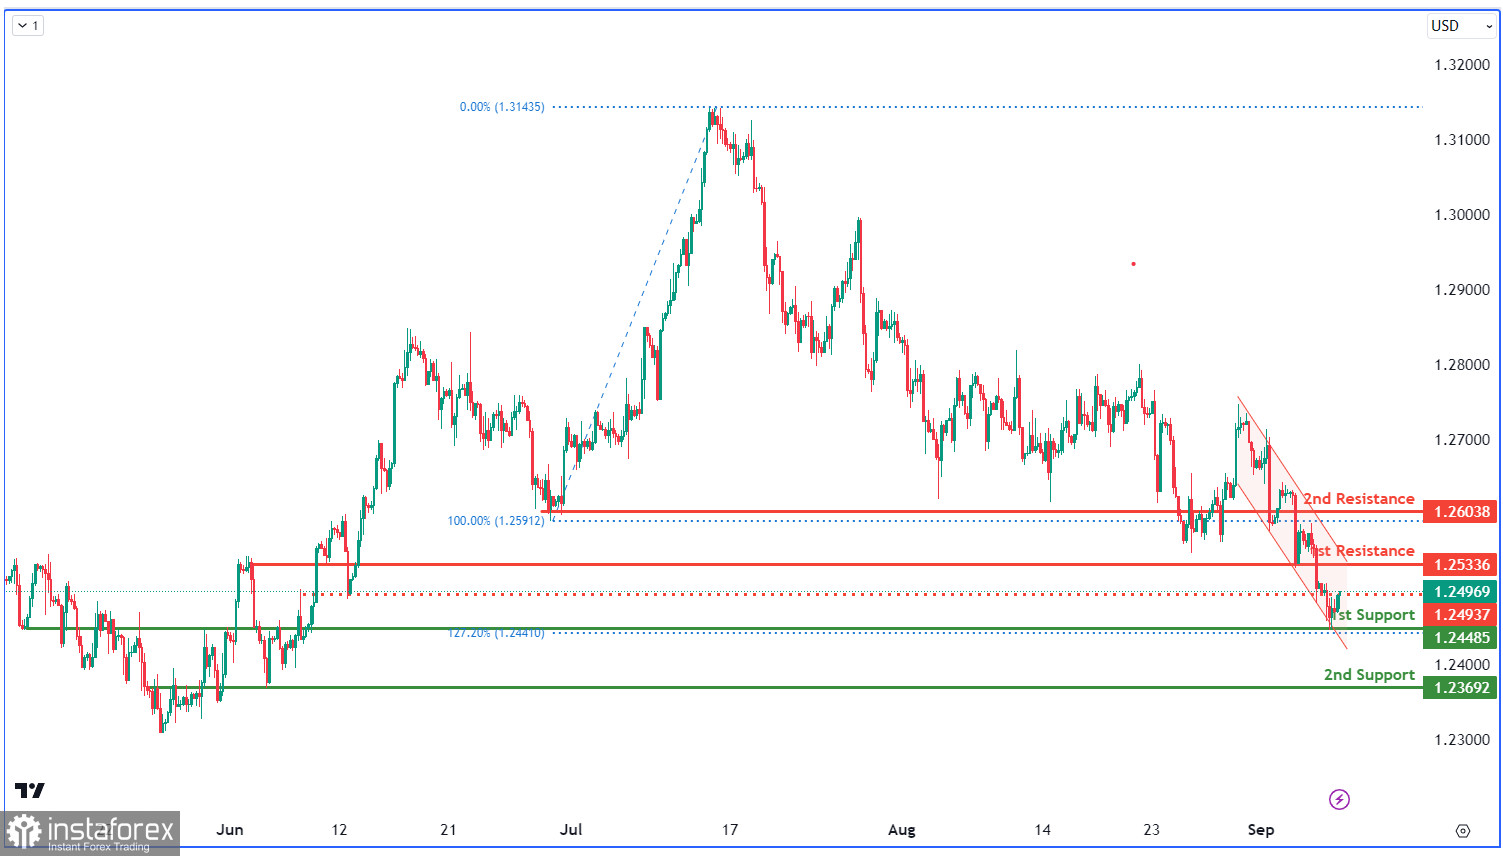
The GBP/USD chart currently shows a bearish momentum within a descending channel. In the short term, it may rise to the first resistance at 1.2533 before potentially reversing and falling to the first support at 1.2448. This support aligns with the 127.20% Fibonacci Expansion, making it significant. Another support is at 1.2369. On the resistance side, the first resistance at 1.2533 is a pullback resistance, with the second resistance at 1.2603 as an overlap resistance. An intermediate resistance at 1.2495 serves as a pullback resistance.


