


Trend analysis (Fig. 1).
The pound-dollar pair may move downward from the level of 1.2272 (closing of yesterday's daily candle) to test 1.2199, the 61.8% pullback level (blue dotted line). When testing this level, the price may move upward to 1.2283, the 76.4% pullback level (blue dotted line).
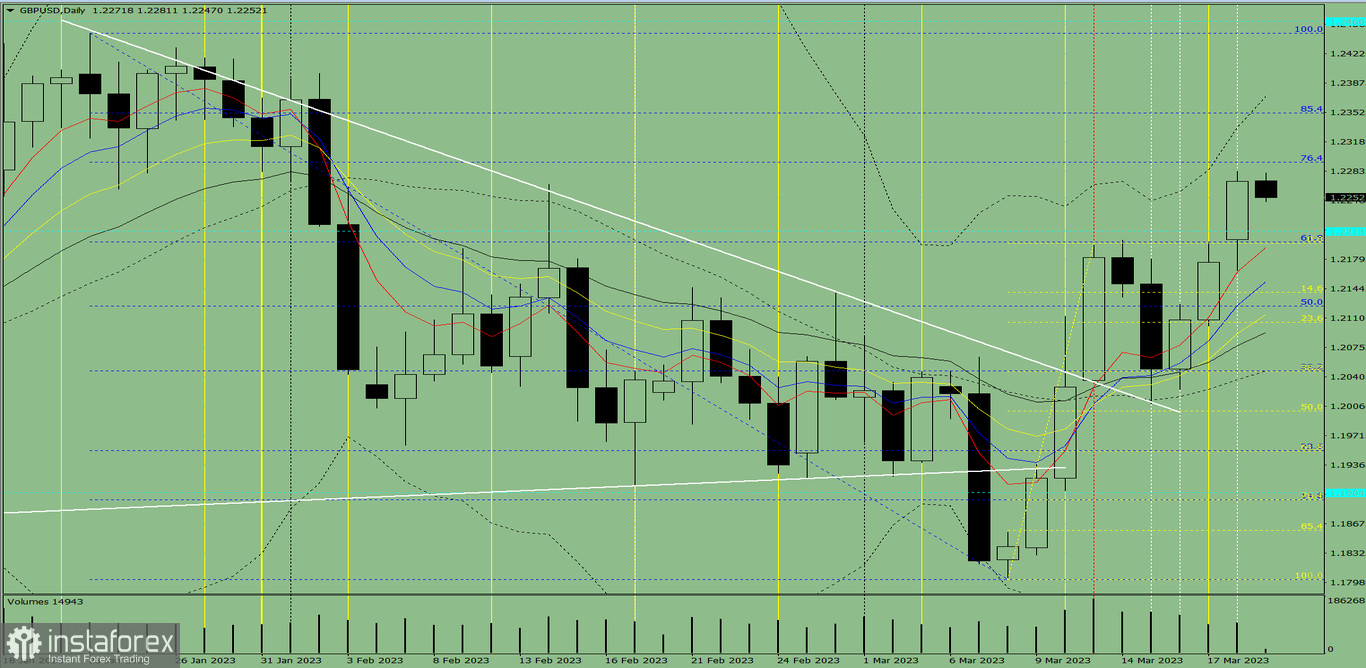
Fig. 1 (daily chart).
Comprehensive analysis:
- Indicator analysis - down;
- Volumes - down;
- Candlestick analysis - down;
- Trend analysis - down;
- Bollinger bands - bottom;
- Weekly chart - down.
General conclusion:
Today, the price may move downward from the level of 1.2272 (closing of yesterday's daily candle) to test 1.2199, the 61.8% pullback level (blue dotted line). When testing this level, the price may move upward to 1.2283, the 76.4% pullback level (blue dotted line).
Alternatively, the price may move downward from the level of 1.2272 (closing of yesterday's daily candle) to test 1.2213, the historical support level (blue dotted line). When testing this level, the price may move up.


