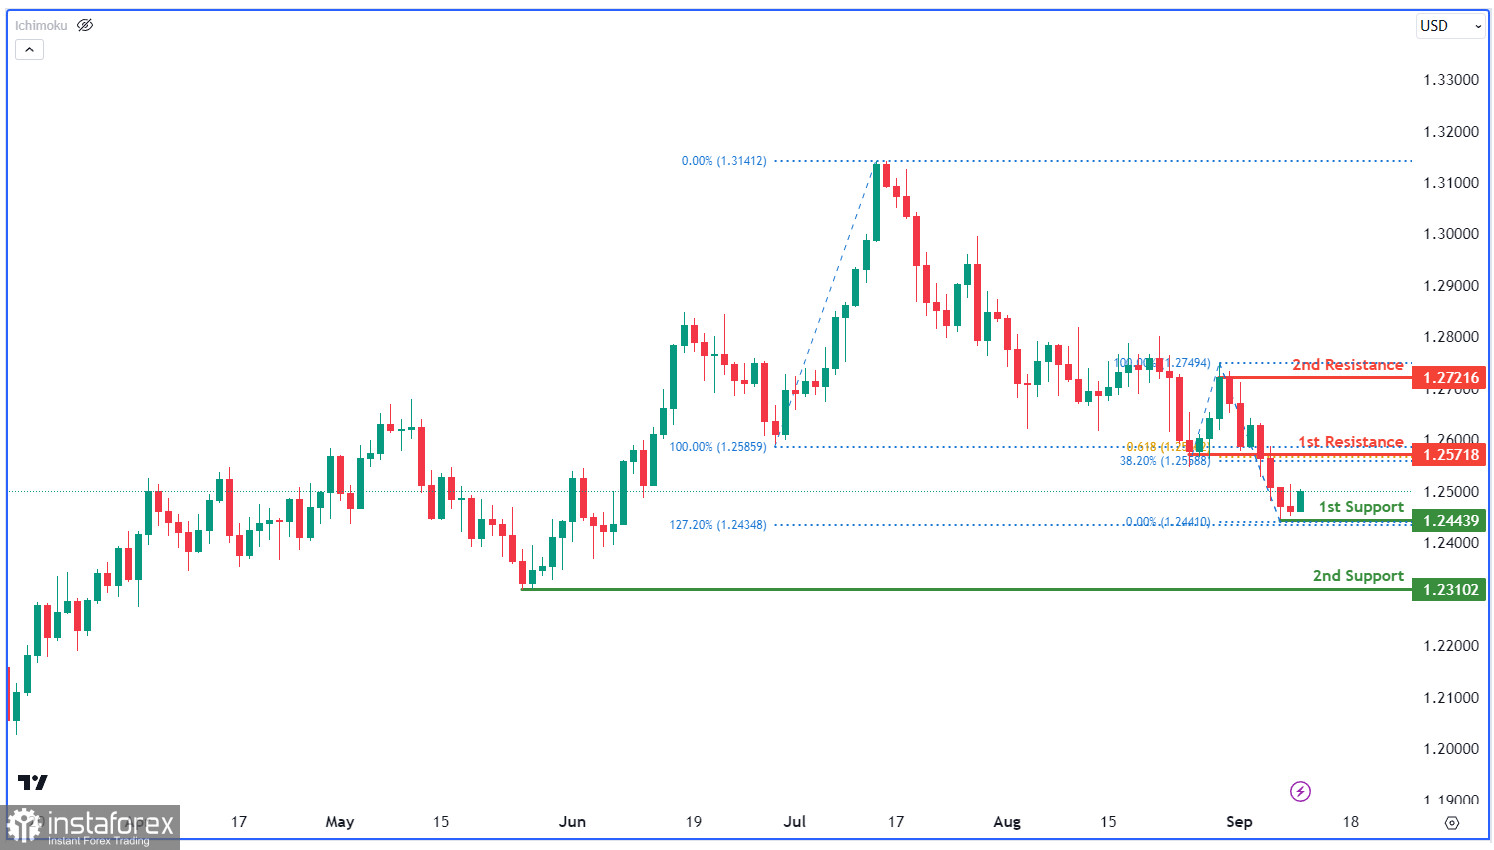
The GBP/USD chart currently displays a bullish momentum, indicating a potential upward price trend. There's a possibility of a bullish bounce at the first support level of 1.2443, which is supported by swing low characteristics and aligns with the 127.20% Fibonacci Expansion. Another support at 1.2310 is marked as a swing low support, reinforcing its potential as a price support area. On the resistance side, the first resistance at 1.2548 is considered a pullback resistance and aligns with the 78.60% Fibonacci Projection. Additionally, the second resistance at 1.2721 represents swing high resistance.


