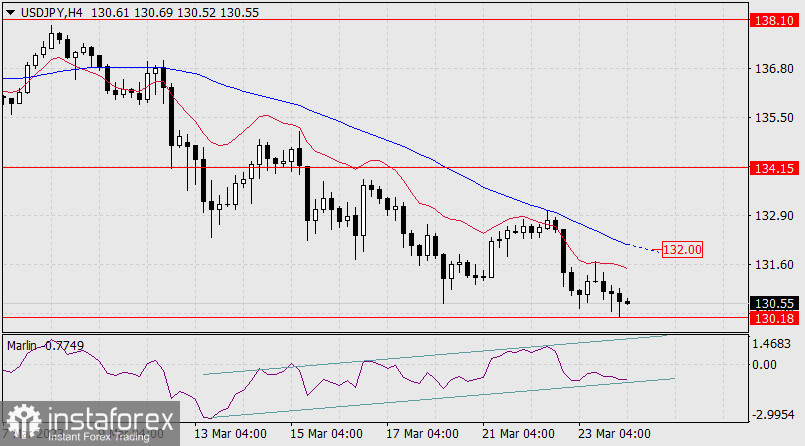
This morning, the price reached the target support on the embedded price hyperchannel line of the monthly chart at 130.18. To achieve this goal, the price had to push through the support of the MACD indicator line. Now, if it goes back above that line, the price will gladly return to the uptrend - the bearish correction from the January 16-March 8 movement was quite deep, over 62%.

On the daily chart, the Marlin oscillator signal line has fallen to current levels in a descending arc and is reversing upward. USD/JPY will aim for the upper line of the embedded price channel at 134.15.

On the four-hour chart, the Marlin oscillator is moving in an ascending channel while the price is falling. At the moment, the signal line of the oscillator is at the lower limit of this channel, and the price could also move upwards. We can confirm the reversal once the price climbs above the MACD line near the 132.00 mark. There's a high probability that a fall below 130.18 will be a false movement.


