


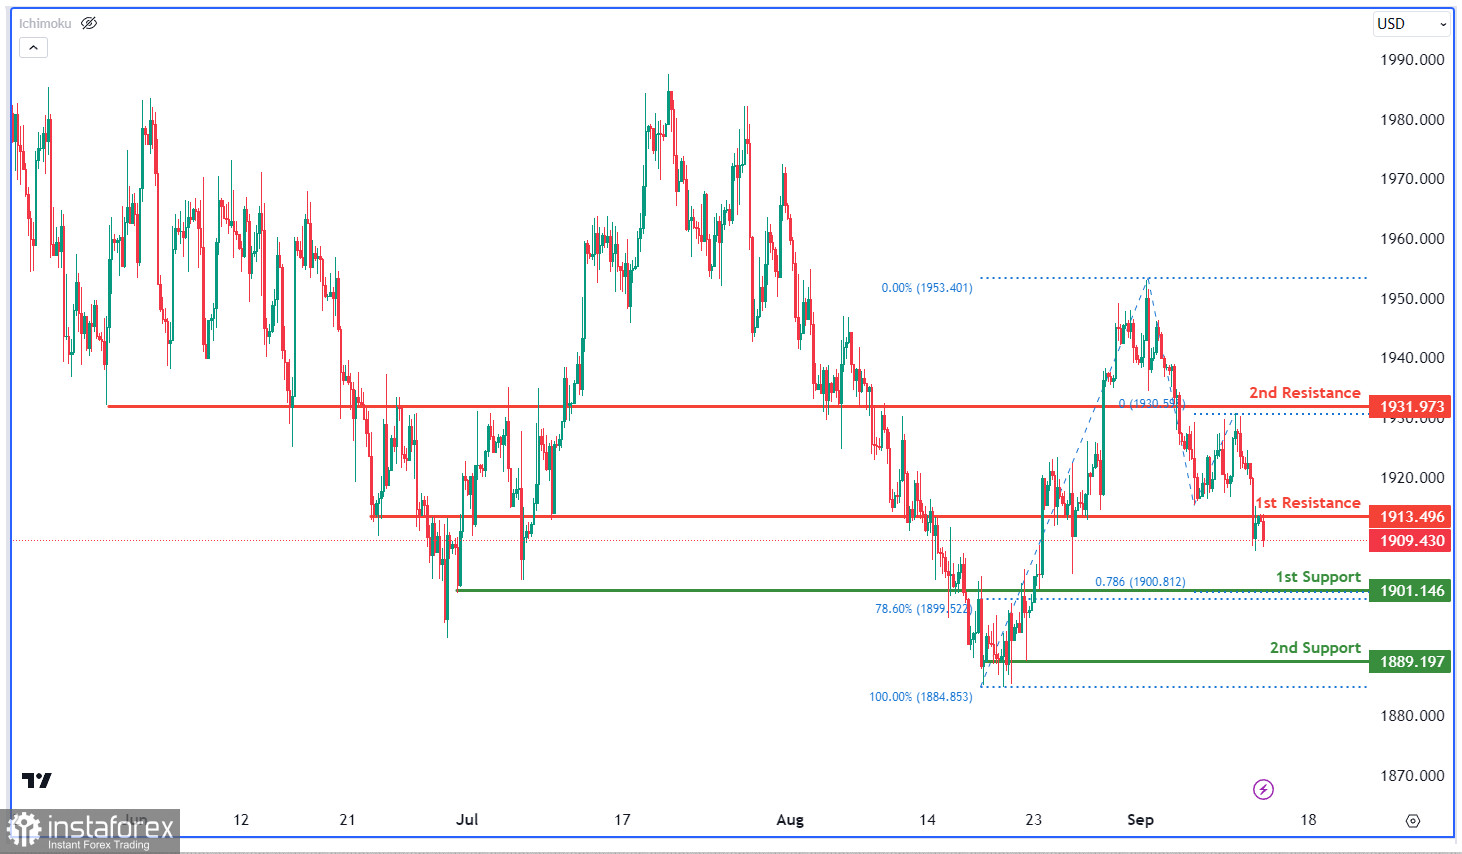
The XAU/USD (Gold/US Dollar) chart shows a bearish momentum with potential for further downside. The 1st support at 1901.14 is a strong zone with overlap support, the 78.60% Fibonacci Retracement, and the 78.60% Fibonacci Projection. The 2nd support is at 1889.19. On the resistance side, the 1st resistance at 1913.49 and the 2nd resistance at 1931.97 are both overlap resistances. These levels are key for traders in the bearish XAU/USD market.


