


Trend analysis (Fig. 1).
The pound-dollar pair may move down from 1.2338 (closing of yesterday's daily candle) to 1.2294, the 76.4% pullback level (blue dotted line). In the case of testing this level, the price may move up with the target of 1.2352, the 85.4% pullback level (blue dotted line).
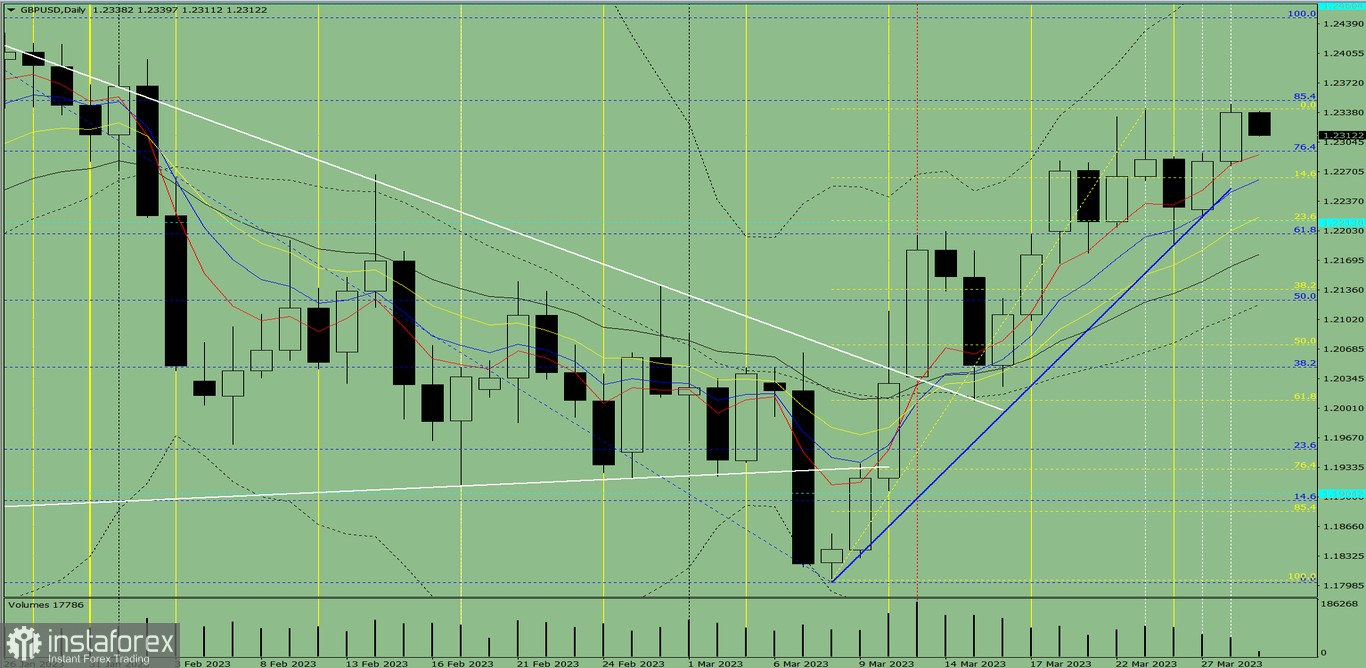
Fig. 1 (daily chart).
Comprehensive analysis:
- Indicator analysis - down;
- Fibonacci levels - down;
- Volumes - down;
- Candlestick analysis - up;
- Trend analysis - up;
- Weekly chart - up;
- Bollinger Bands - up.
General conclusion:
Today, the price may move down from 1.2338 (closing of yesterday's daily candle) to 1.2294, the 76.4% pullback level (blue dotted line). In the case of testing this level, the price may move up with the target of 1.2352, the 85.4% pullback level (blue dotted line).
Alternatively, the price may move down from the level of 1.2338 (closing of yesterday's daily candle) to 1.2264, the 14.6% pullback level (yellow dotted line). In the case of testing this level, the price may move up with the target of 1.2352, the 85.4% pullback level (blue dotted line).


