


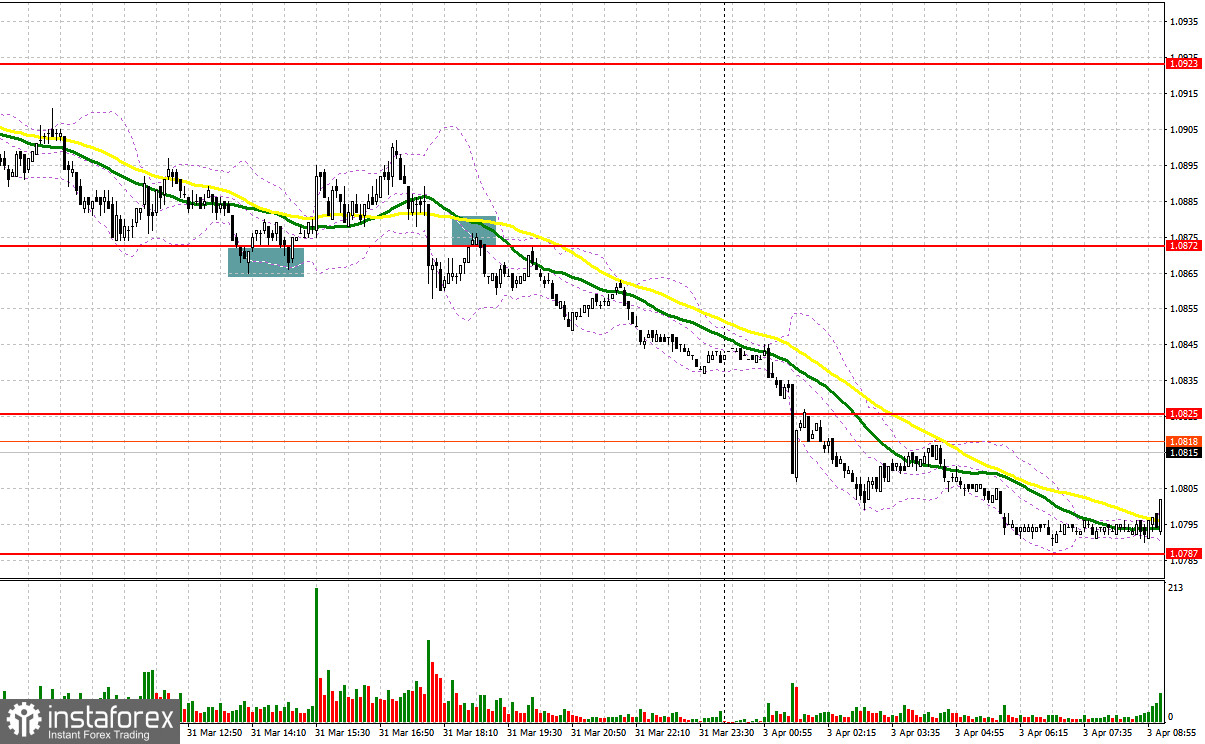
Last Friday, the pair formed several good entry signals. Let's discuss what happened on the 5-minute chart. In my morning review, I mentioned the level of 1.0872 as a possible entry point. A decline to this level and its false breakout generated a buy signal. However, inflation data in the eurozone dashed hopes of the euro bulls. So, after an upside move of 20 pips, the pair came under pressure again. In the second half of the day, another failed attempt to break below 1.0872 allowed the bulls to get another entry point into long positions. As a result, the pair jumped by 25 pips. Only by the middle of the New York session, a breakout of the 1.0872 level and its retest created a sell signal, thus sending the euro down by 30 pips.
For long positions on EUR/USD:
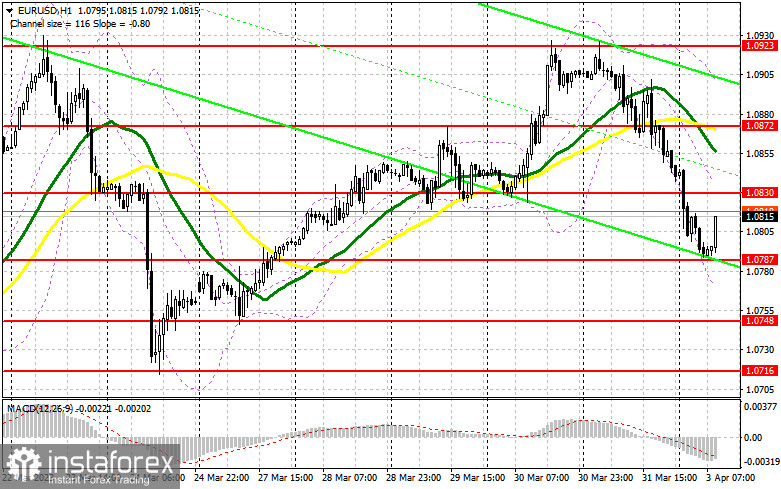
The euro may stay under pressure today as fundamental reports may come in worse than expected. The downbeat data on the PMI manufacturing index in Germany and the eurozone may weigh on the pair, thus sending it lower to the nearest support of 1.0787. I would recommend focusing on this level today. The speech by Elizabeth McCaul, the Member of the Supervisory Board of the ECB, is unlikely to influence the trajectory of the pair. A false breakout at 1.0787 will form a nice entry point into long positions, considering the start of a new upward cycle. If so, the price may rise toward the nearest resistance of 1.0830 formed on Friday. A breakout and a retest of this level will create an opportunity for adding more long positions on the pair with an upward target at 1.0872. This is where moving averages support the bears. The level of 1.0923 is the furthest target where I will be taking profit. If EUR/USD declines and bulls are idle at 1.0787, which is very likely in the current conditions, the euro will come under pressure and may drop to 1.0748. Only a false breakout at this point will generate a buy signal. I will open long positions right after a bounce from the low of 1.0716 or 1.0674, considering an upside intraday correction of 30-35 pips.
For short positions on EUR/USD:
Bears met all their goals and sent the euro down by the end of the month. The main task for them right now is to hold near the resistance level of 1.0830 where large market players may step in. The best moment to open new short positions will be a false breakout of this level after the disappointing data on the eurozone business activity is released. This may result in the decline of the pair toward the nearest support of 1.0787. Its breakout and a retest will intensify the selling pressure so that the pair may slide to 1.0748. If the price settles below this range, it may then head for 1.0716, further developing the downtrend. This is where I'm planning to take profit. If EUR/USD advances in the course of the European session and bears are idle at 1.0830, which is quite possible, it would be wise to wait until the pair hits the level of 1.0872. Selling there will be possible only after a failed attempt to hold at this level. I will go short on the pair right after a pullback from the high of 1.0923, keeping in mind a downward correction of 30-35 pips.
COT report
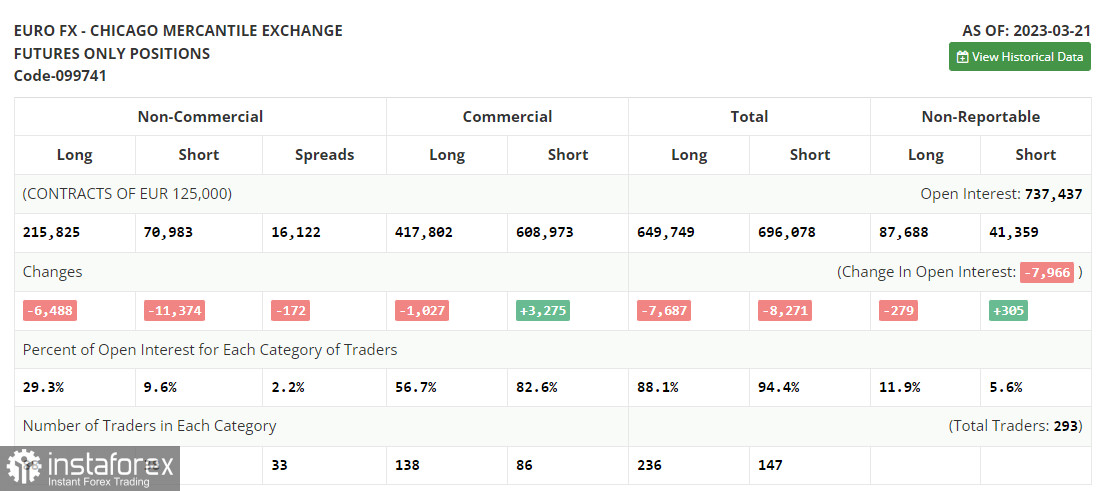
The Commitments of Traders report for March 21 recorded a drop in both long and short positions. The Fed's policy meeting in March changed the market sentiment to a certain extent. However, given the fact that the FOMC hasn't drastically changed its policy, the US dollar is unlikely to depreciate strongly against the euro in the short term. The only bullish factor for the euro right now is the aggressive stance of the European Central Bank. The EU regulator is actively raising rates and is determined to stick to this policy in the future. According to the latest COT report, long positions of the non-commercial group of traders dropped by 6,488 to 215,825, while short positions fell by 11,374 to 70,983. By the end of the week, the non-commercial net position rose to 144,842 from 139,956. The weekly closing price appreciated to 1.0821 versus 1.0803.
Indicator signals:
Moving Averages
Trading below the 30- and 50-day moving averages indicates a further decline in the euro.
Please note that the time period and levels of the moving averages are analyzed only for the H1 chart, which differs from the general definition of the classic daily moving averages on the D1 chart.
Bollinger Bands
In case of a decline, the lower band of the indicator at 1.0760 will act as support.
Description of indicators:
• A moving average of a 50-day period determines the current trend by smoothing volatility and noise; marked in yellow on the chart;
• A moving average of a 30-day period determines the current trend by smoothing volatility and noise; marked in green on the chart;
• MACD Indicator (Moving Average Convergence/Divergence) Fast EMA with a 12-day period; Slow EMA with a 26-day period. SMA with a 9-day period;
• Bollinger Bands: 20-day period;
• Non-commercial traders are speculators such as individual traders, hedge funds, and large institutions who use the futures market for speculative purposes and meet certain requirements;
• Long non-commercial positions represent the total number of long positions opened by non-commercial traders;
• Short non-commercial positions represent the total number of short positions opened by non-commercial traders;
• The non-commercial net position is the difference between short and long positions of non-commercial traders.


