


trend analysis.
EUR/USD will likely decline in April from the level of 1.0838 (closing of the March monthly candle) to 1.0679, the 23.6% pullback level (yellow dotted line). When testing this level, the price may move upward with the target of 1.1033, the upper fractal (yellow dotted line).
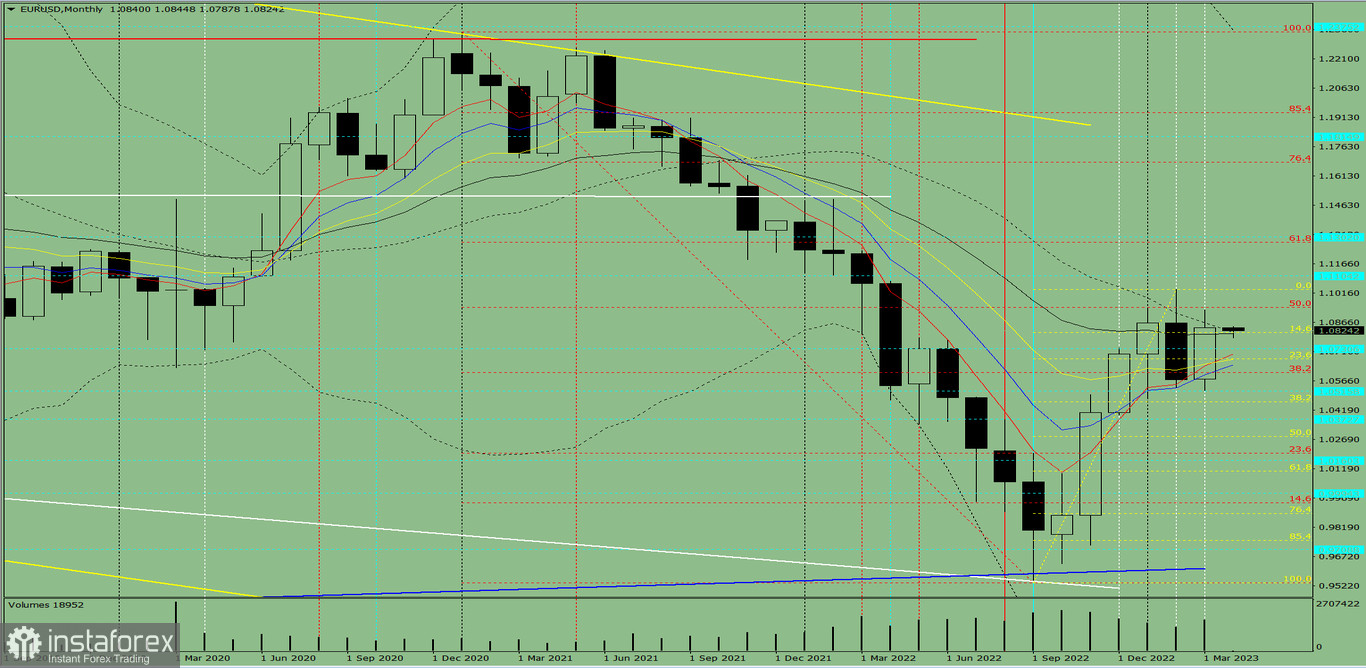
Fig. 1 (monthly chart).
Comprehensive analysis:
- Indicator analysis - down;
- Fibonacci levels - down;
- Volumes - down;
- Candlestick analysis - down;
- Trend analysis - up;
- Bollinger bands - up;
All these points to a downward movement in EUR/USD.
Conclusion: The pair will have a bearish trend, with no first upper shadow on the monthly black candle (the first week of the month is black) and a second lower shadow (the last week is white).
Throughout the month, quotes will likely decline from the level of 1.0838 (closing of the February monthly candle) to 1.0679, the 23.6% pullback level (yellow dotted line). When testing this level, the price may move upward with the target of 1.1033, the upper fractal (yellow dotted line).
Alternatively, from the level of 1.0838 (closing of the March monthly candle), a downward pullback is possible with the target of 1.0731, the historical resistance level (blue dotted line). When testing this level, the price may move upward with the target at 1.0941, the 50% pullback level (red dotted line).


