


To open long positions on the GBP/USD, you must have the following:
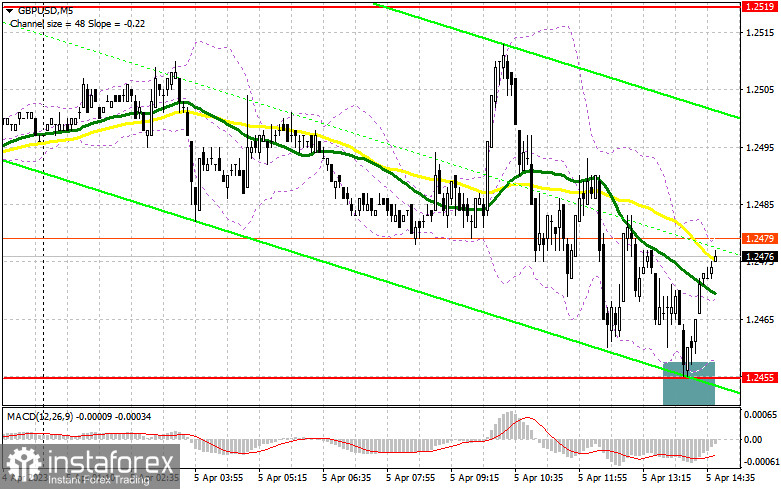
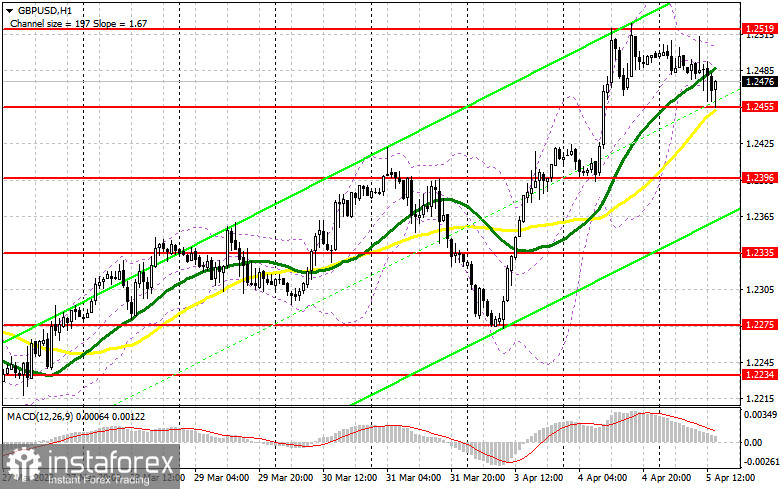
If trading occurs above 1.2455, we may anticipate a pound recovery. Strong data on the U.S. labor market will cause the GBP/USD pair to re-enter the 1.2455 support zone, which it tested during the European session. As a result, there is substantially less faith at 1.2455 than in the morning. Only a weak report and the formation of a false breakout there will allow you to receive another buy signal similar to what I stated previously. The target will be the resistance level of 1.2519. A move to 1.2551 will provide a market entry point following consolidation and a top-down test of this area. The break of this range will clear the path to 1.2592, where I've set my profit target. If the bulls cannot complete the assigned tasks and miss 1.2455 in the afternoon, or if there is little activity, a larger correction can be expected. In this situation, I will only initiate long positions on a false breakout in the area of the next support at 1.2396. I intend to purchase GBP/USD immediately on a rebound from the minimum of 1.2335 to correct 30-35 points within a day.
To establish short trades in GBP/USD, you must have the following:
However, the report on the foreign trade deficit and the ISM index of business activity in the services sector may put pressure back on the euro because the U.S. labor market data could undermine the dollar's position due to the sharp loss of jobs anticipated. So, if the pair rises, sellers must appear around 1.2519; they will not have another opportunity. After failing to reach this level, bulls will have an opportunity to resume the rise. Only a false breakout at 1.2519 will provide a sell signal, resulting in a renewed decline of GBP/USD to the support area at 1.2455, where bullish moving averages are in action. A breakout and a reverse bottom-up test of this range will intensify the pressure on the pound, generating a sell signal at 1.2396. This will be a reasonably strong correction to stop the rise. The farthest target remains a minimum of 1.2335, the test of which will block all purchasers' expectations for the pound's continued growth. They are considering the possibility of a GBP/USD increase and lack of action at 1.2519 in the afternoon, which is also quite plausible, postponing sales until the test of the new high at 1.2551. There is no entry point for short positions until a false breakout occurs. If there is no negative movement, I will sell GBP/USD for an immediate rebound from the daily high of 1.2592, but only if the pair corrects by 30-35 points within the trading day.
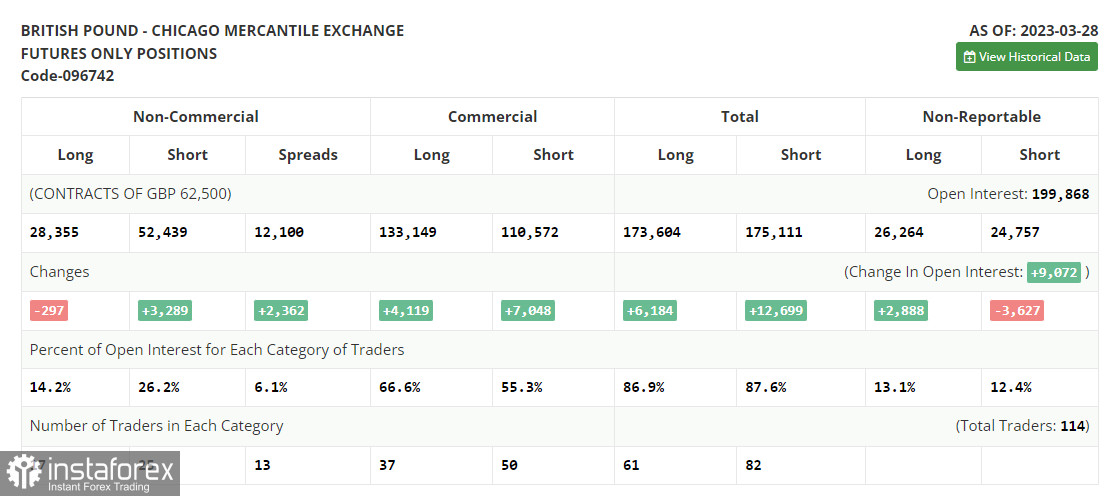
In the Commitment of Traders (COT) report for March 28, there was a decrease in long positions and a rise in short positions. In actuality, the balance of power has not shifted significantly. The published data on the upward adjustment of the U.K.'s fourth-quarter GDP growth rate was sufficient to maintain the pound's monthly highs and restore them at the start of this month. The words made by the Governor of the Bank of England, Andrew Bailey, were also sufficient to anticipate an additional increase in interest rates, which benefited buyers. According to the most recent COT data, short non-commercial positions increased by 3,289 to 52,439. In contrast, long non-commercial positions declined by 297 to 28,355, resulting in a rise in the negative value of the non-commercial net position to -24,084 from -20,498 the previous week. The closing price for the week increased to 1.2358 from 1.2241.
Signals from indicators
Moving Averages
The lateral nature of the market is shown by the fact that trading happens around the 30-day and 50-day moving averages.
Note: The author considers the time and prices of moving averages on the hourly chart H1, which differs from the standard definition of daily moving averages on the daily chart D1.
Bollinger Bands
The lower limit of the indicator at 1.2455 will provide support in the event of a fall.
Description of indicators
- Moving average (moving average determines the current trend by smoothing out volatility and noise). Period 50. The graph is marked in yellow.
- Moving average (moving average determines the current trend by smoothing out volatility and noise). Period 30. The graph is marked in green.
- MACD indicator (Moving Average Convergence / Divergence - moving average convergence/divergence) Fast EMA period 12. Slow EMA period 26. SMA period 9
- Bollinger Bands (Bollinger Bands). Period 20
- Non-profit speculative traders, such as individual traders, hedge funds, and large institutions, use the futures market for speculative purposes and to meet certain requirements.
- Long non-commercial positions represent the total long open position of non-commercial traders.
- Short non-commercial positions represent the total short open position of non-commercial traders.
- Total non-commercial net position is the difference between the short and long positions of non-commercial traders.


