


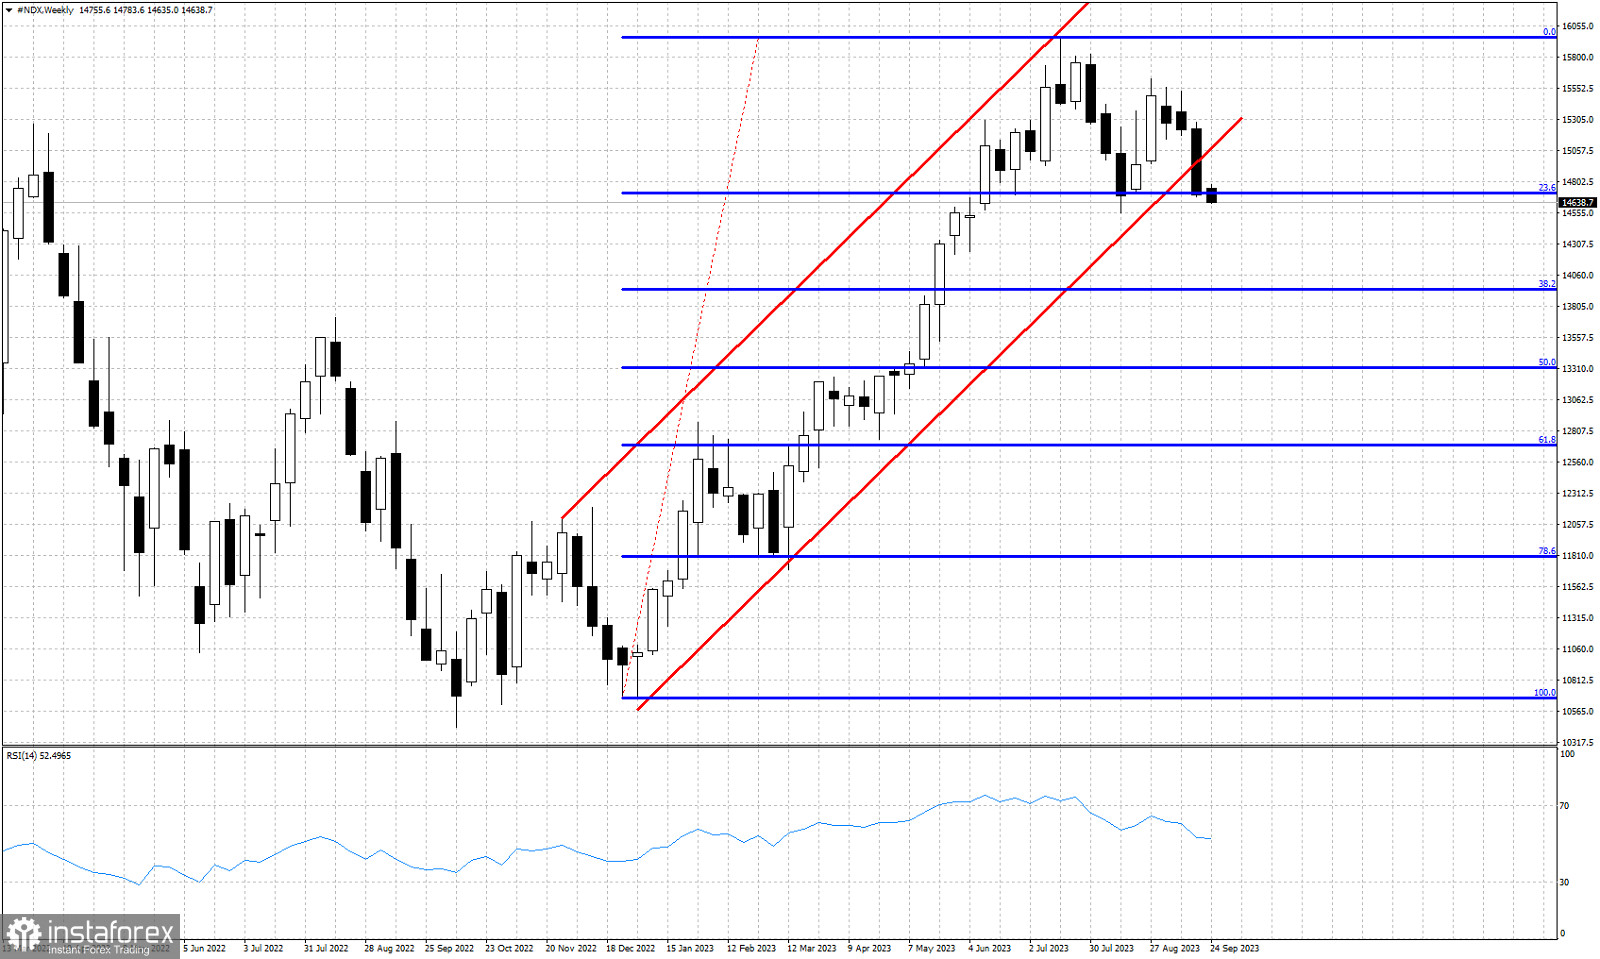
Red lines- bearish channel
Blue lines - Fibonacci retracement levels
NASDAQ index is trading at 14,660. Last Friday the week closed with the index breaking below and out of the bullish channel it was in since October of 2022. Price is very close to forming new weekly lows. Exiting the bullish channel is a sign of weakness. A break to new weekly lows will be an added sign of weakness suggesting that we should expect the index to move lower towards at least the 38% Fibonacci retracement level. The lows at 14,554 are very crucial. Bulls need to defend this level otherwise we should expect more downside.


